timeline
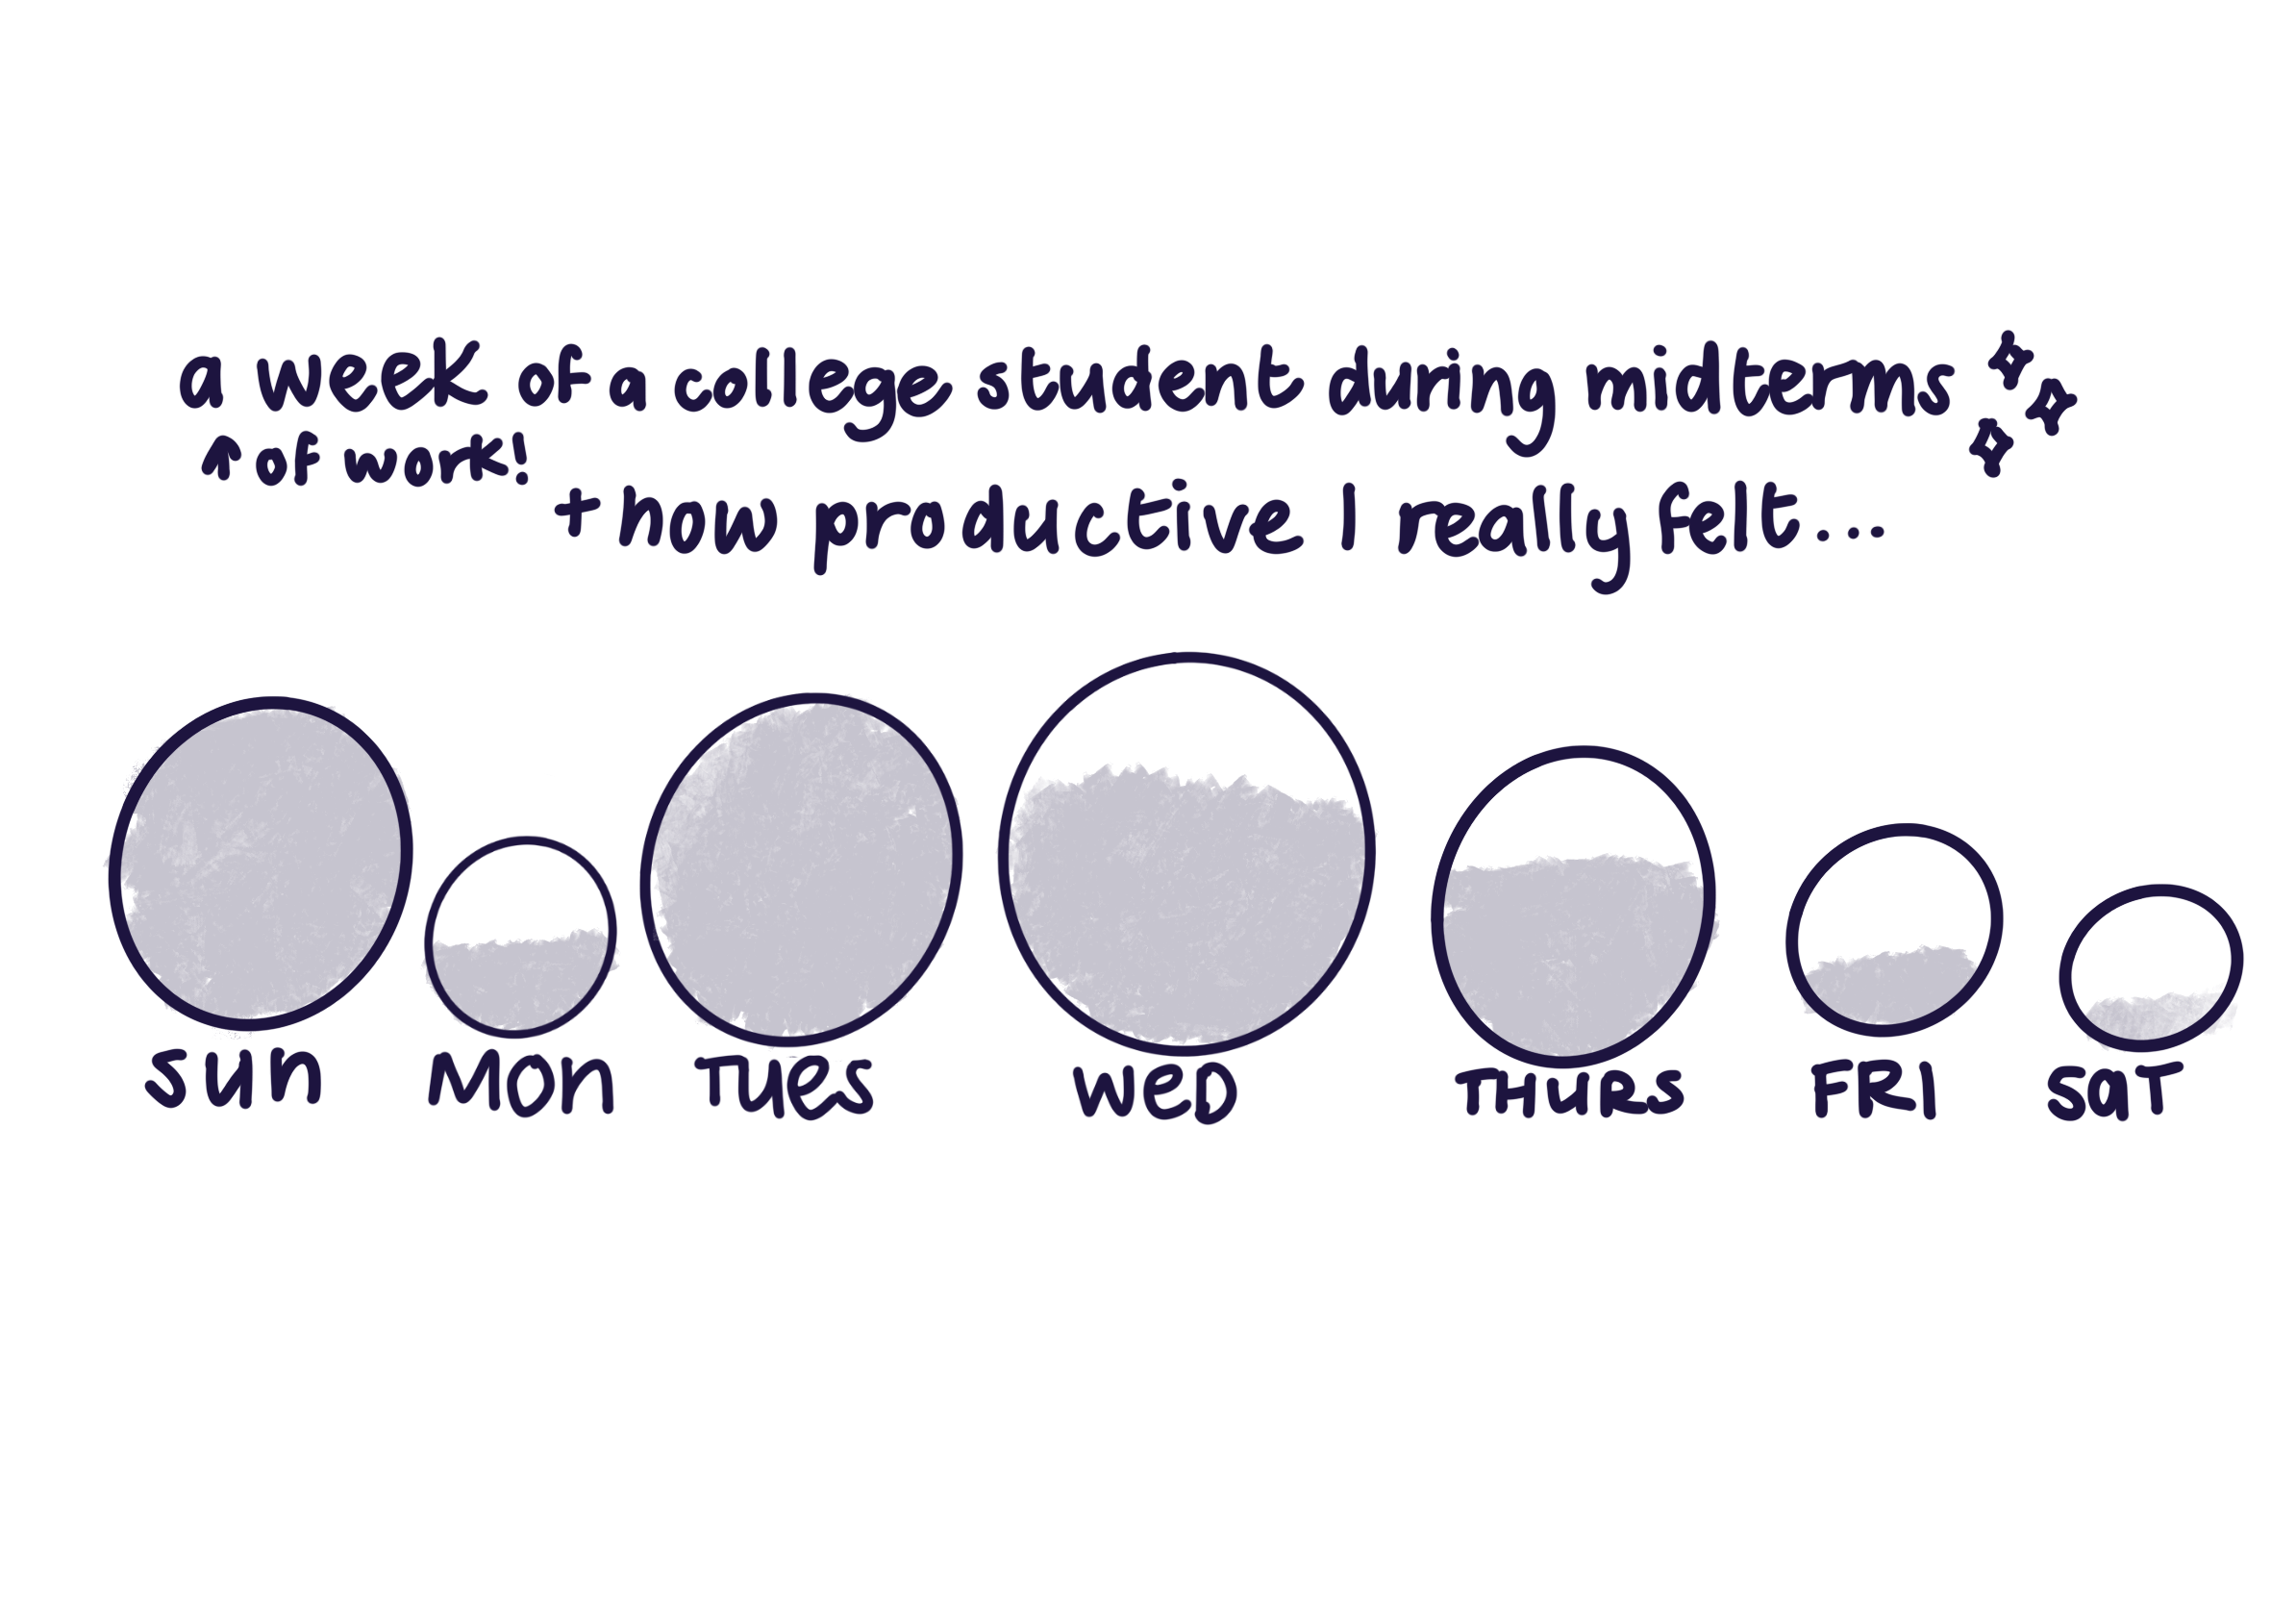
for my timeline i decided to represent how my midterms week went as represented by little bubbles. the bigger the bubble is means there was more work i planned out to do that day, and similarly if there’s a smaller bubble, it means i planned out less work in comparison to other days. i measured this relative to how productive i was feeling as a result of how much work i planned out to do, and how much work i was really able to get done. this is represented by how much i filled in the bubbles. the more filled it is means i felt really productive taht day, and any less shows that i felt like i was lacking a bit. or more than a bit. undergrad is hard as you can see :]