Play with fushion tables-filter information
My focus on filtering information.
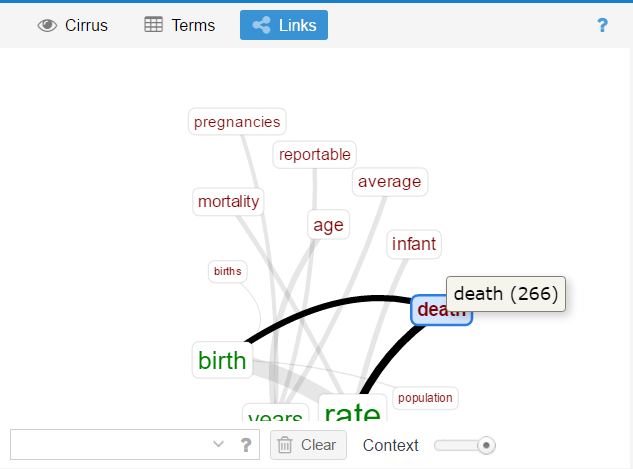
 Fusion Table is a Location based map, easy to start for beginners. The locations are all recorded as points. The heat map could show the density of points.
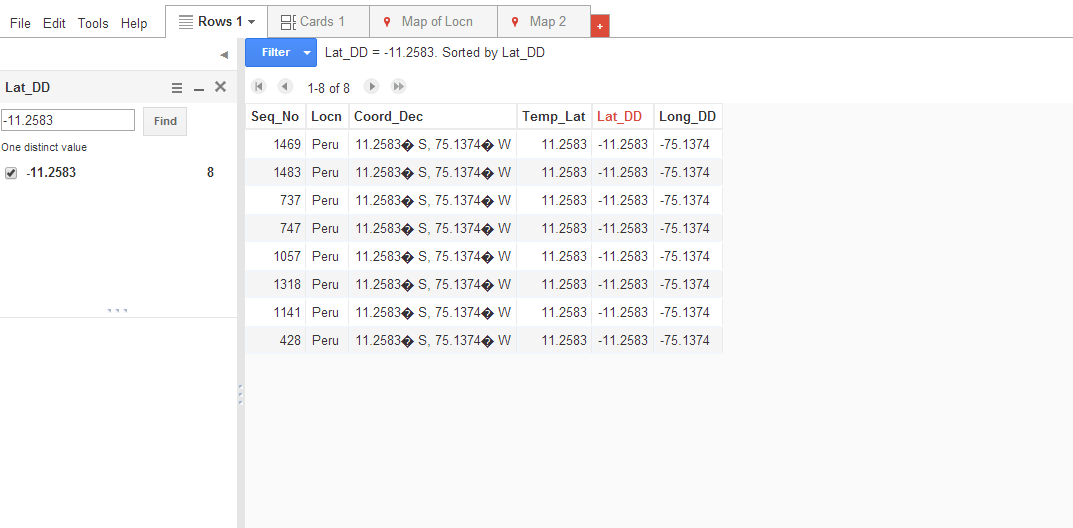 Based on all the locations, I wonder if it could filter data for specific locations. I choose the latitude as my way to filter data. For one specific number, it is easy to do and will calculate the total number for you.
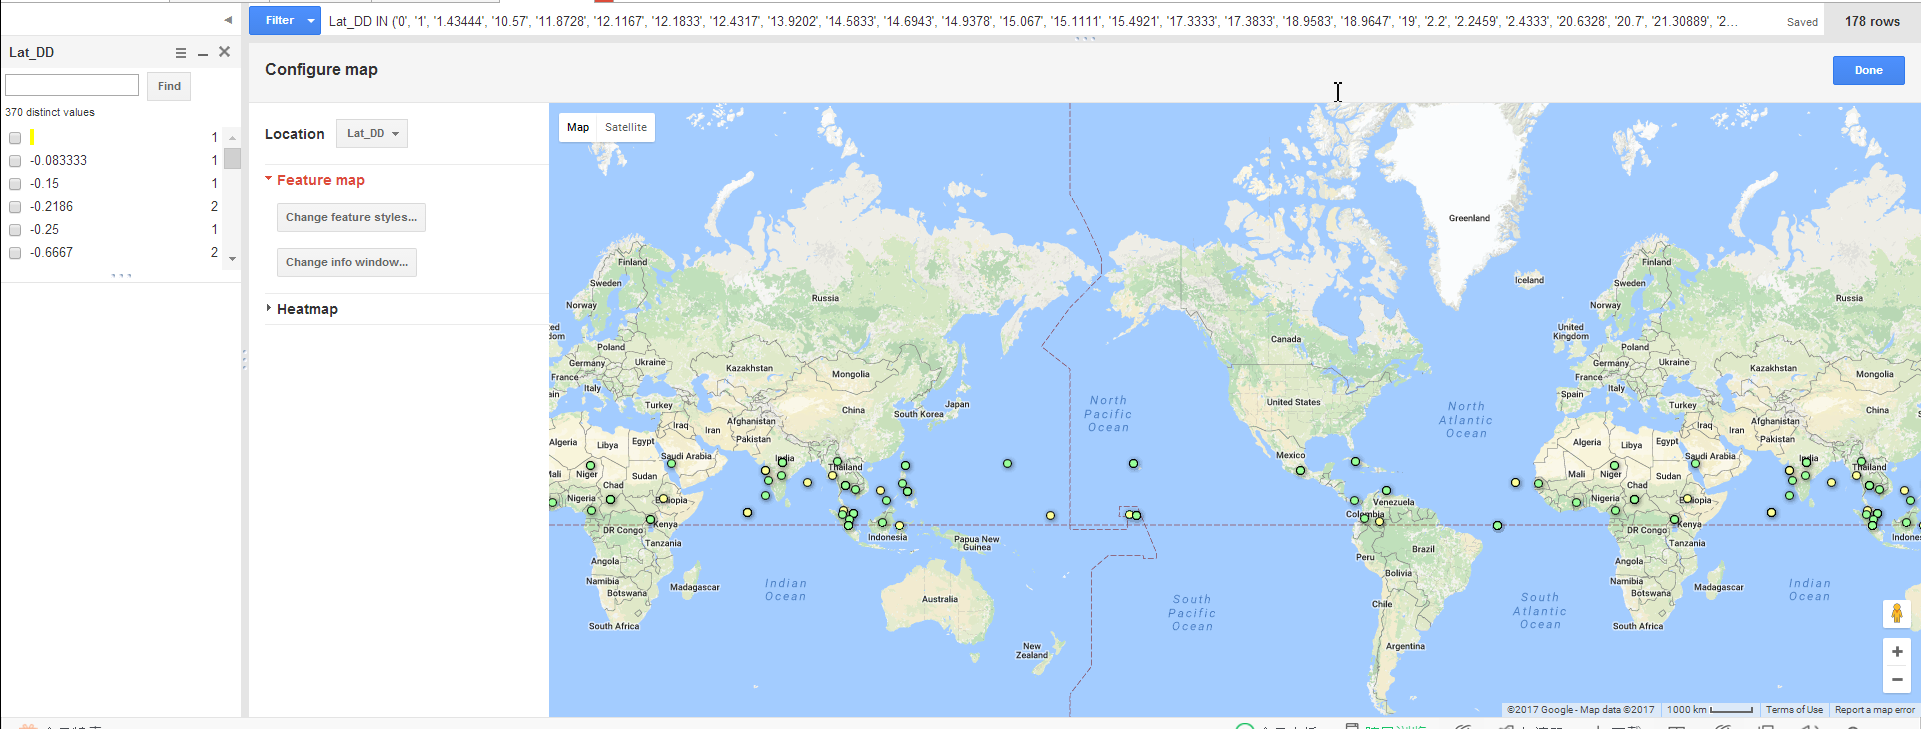 But when I would like to select a range, it is not so convenient. I tried to select the locations between the equator and the Tropic of Cancer. I need to choose them one by one by hand from the left column.
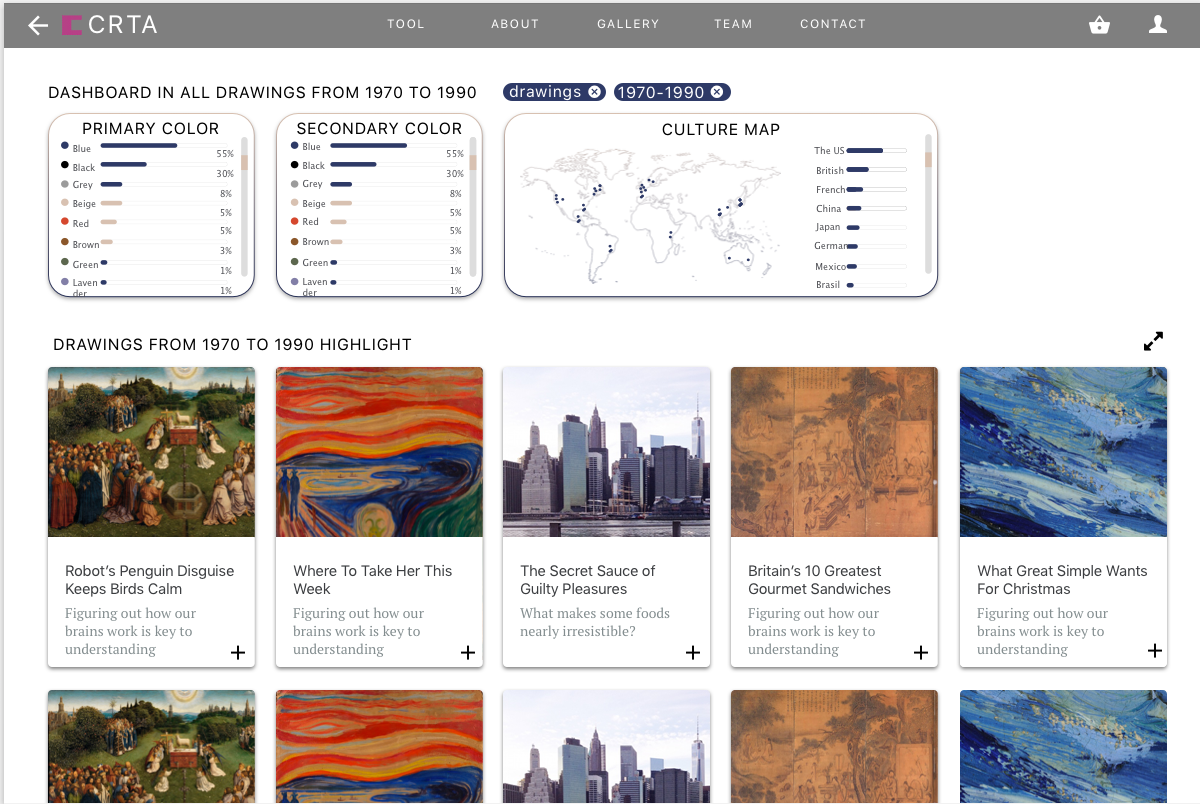
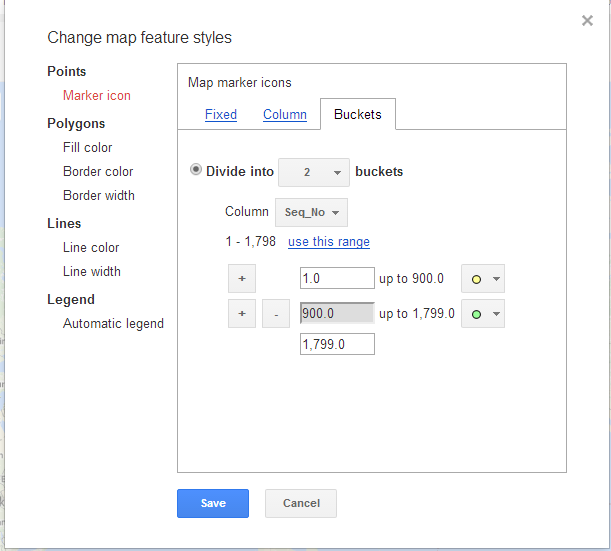 For further filter, I tried to change feature styles and use the buckets and take year as a way to further differentiate tha data.
It has achieved two-step selection by now but they are all fixed data. Time could not play its role in presenting the sequence from the earliest to the latest. I hope that the points could appear dynamically from the earliest to the latest.
Enter text in Markdown. Use the toolbar above, or click the ? button for formatting help.