Assignment 5: Visualizing Time, Space, and Narrative
Proposal
Based on the mockups, data, and our own interests, we propose to visualize Melville’s travels in London. We’d like to show his routes through the city in a way that allows the viewer to understand where Melville travelled: which neighborhoods, which roads, which landmarks. The viewer should be able to pick out which days they’d like displayed on the map at once.
As a potential augmentation of this idea, although subject to time and technical constraints, we’d like to also dynamically show a histogram of how frequently each location was visited. This would be updated based on the days selected.
Process
After exploring the two datasets (of Ibn Jubayr’s travels in the Middle East, and Melville’s travels in London) we brainstormed a few different ideas. Based on the nature of the data, we’re certain we want to incorporate a map as the main visualization element. The way the map functions will be different for different goals.
Some raw ideas based on the data:
- Ibn Jubayr:
- Calculate the speed of travel, particularly between major cities, and visualize the routes based on the speed (faster = easier, slower = more difficult)
- Calculate a “similarity” relationship between all of the places based on the text associated with each entry
- Melville:
- Use a heatmap to show which places, roads might have been visited most frequently
- Create a “cast” of the people Melville met with, and show where they interacted, filterable by character
- Visualize how far Melville traveled each day based on modern-day walking routes between these places
- Explore which days were similar in terms of destinations and order thereof, to try to see if Melville kept to any sort of routine or routines.
Some ideas with mockups:
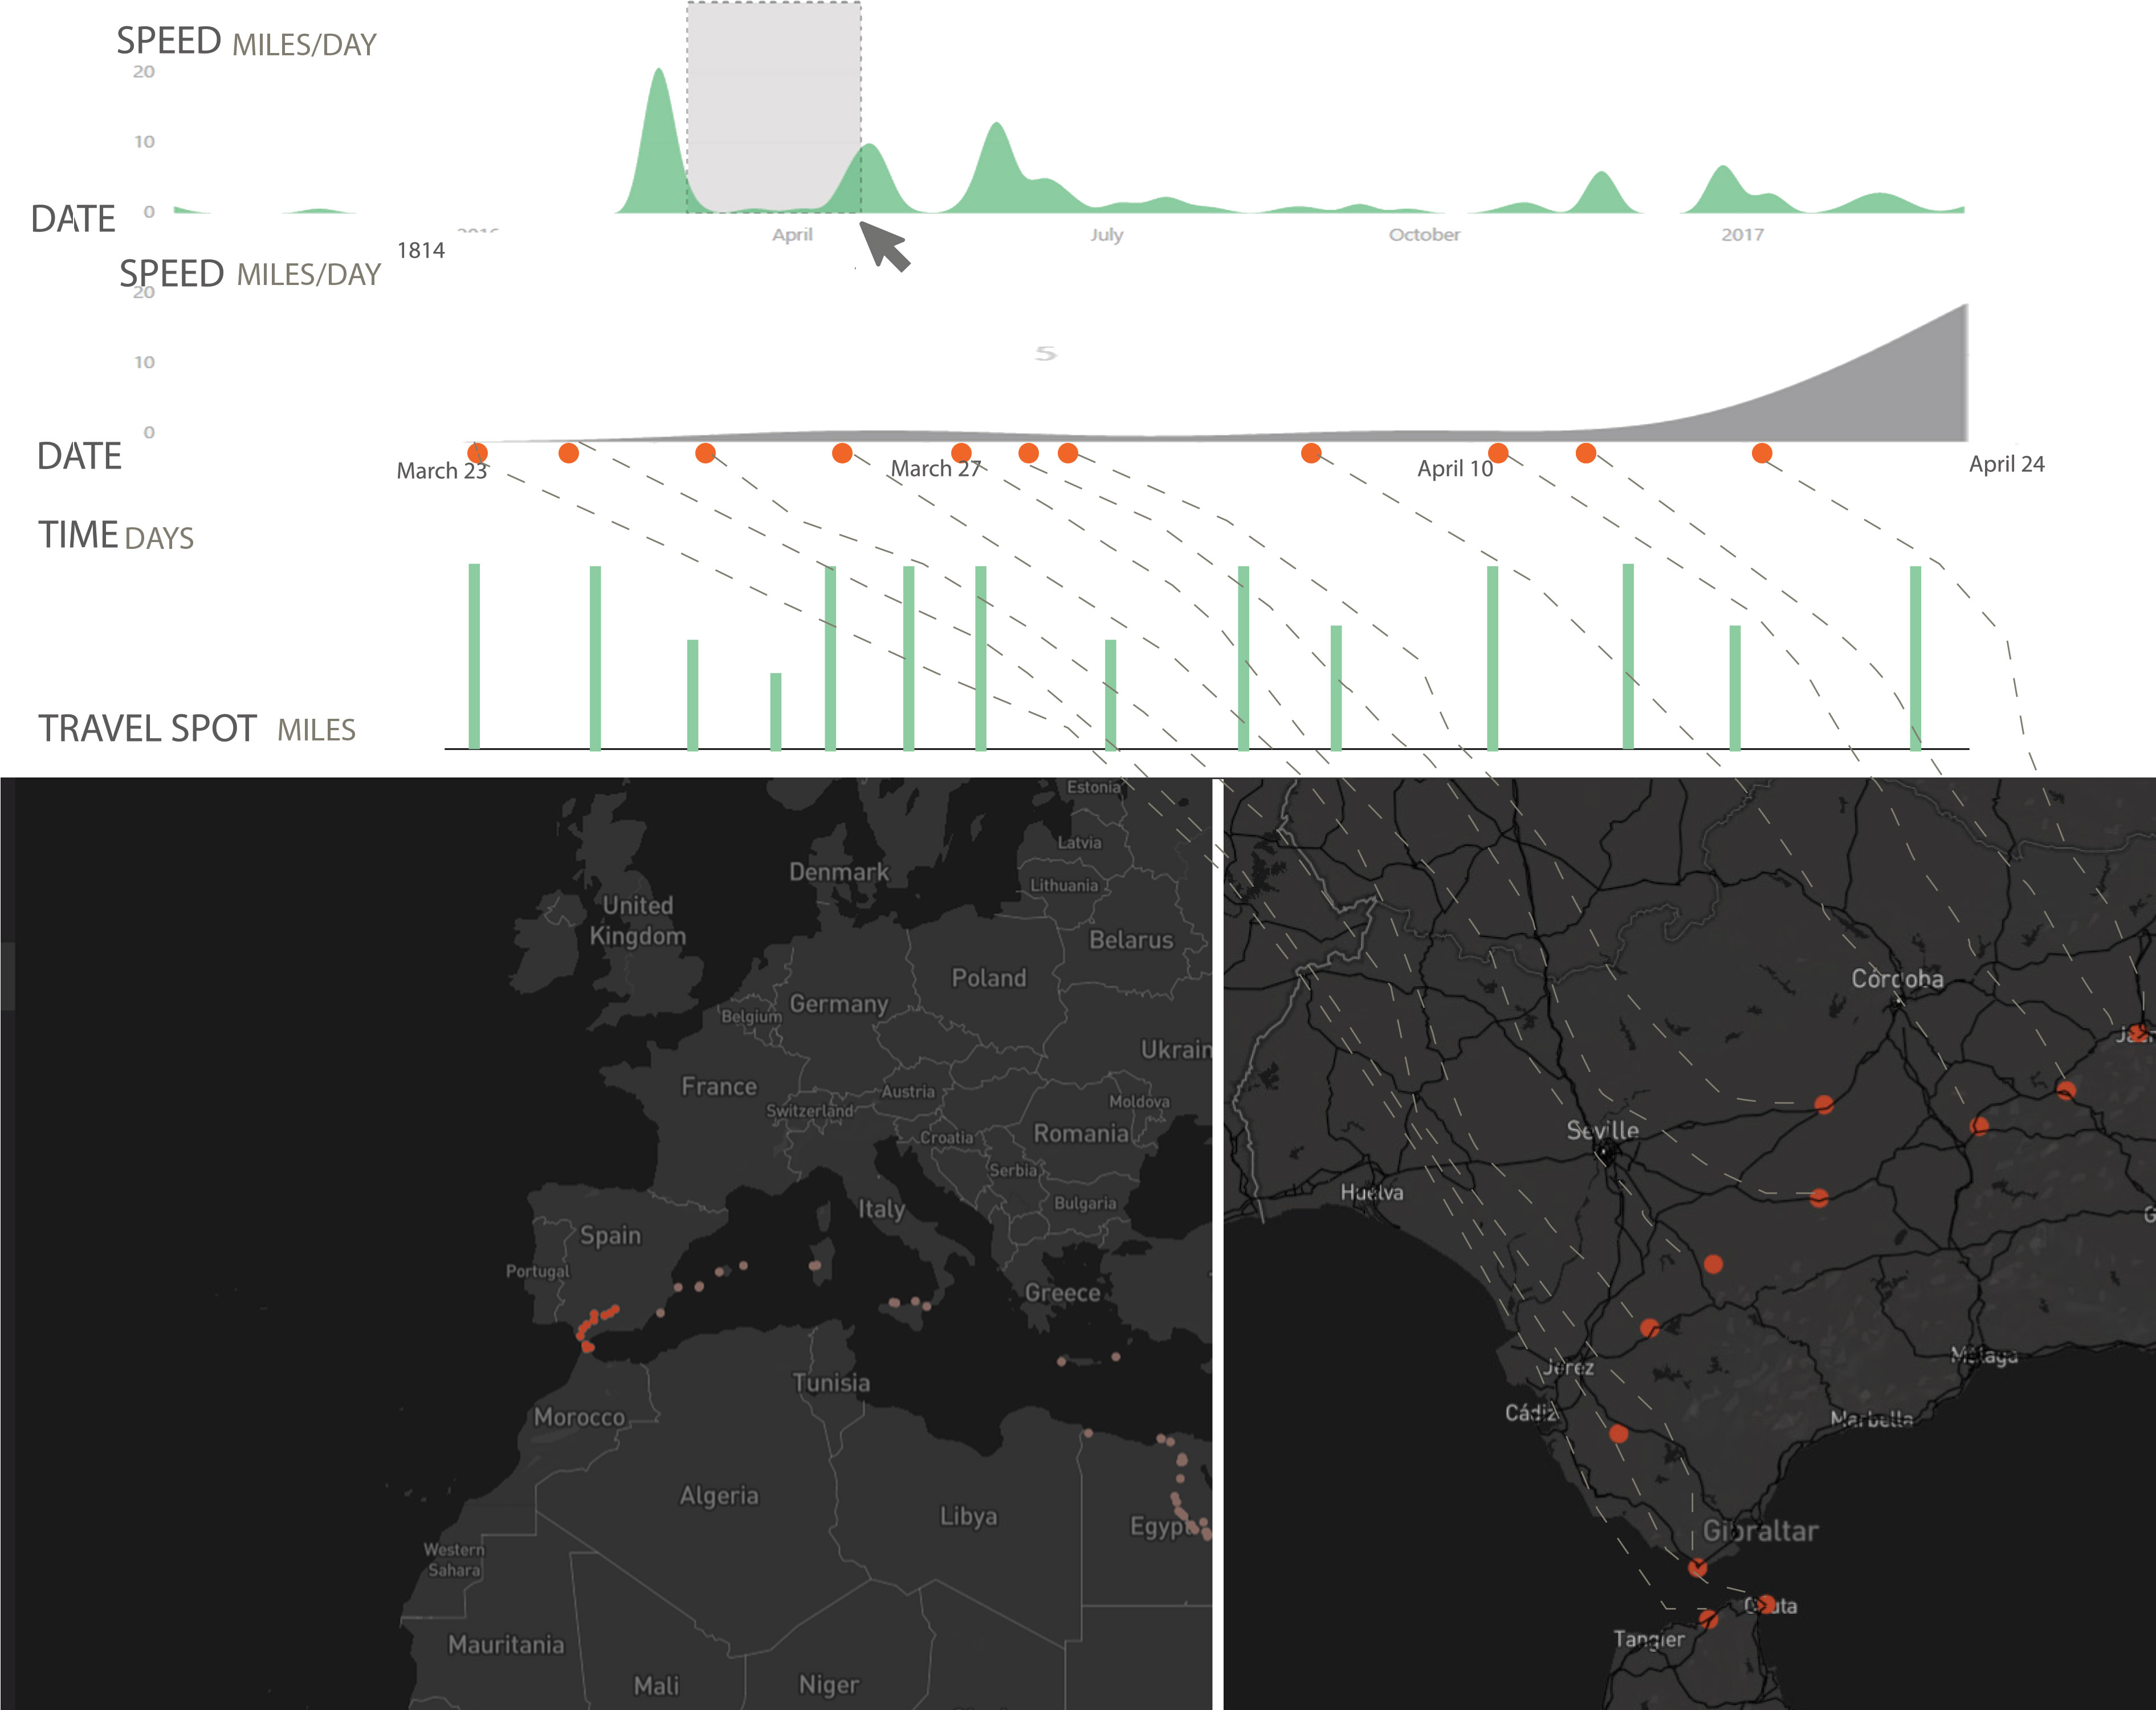
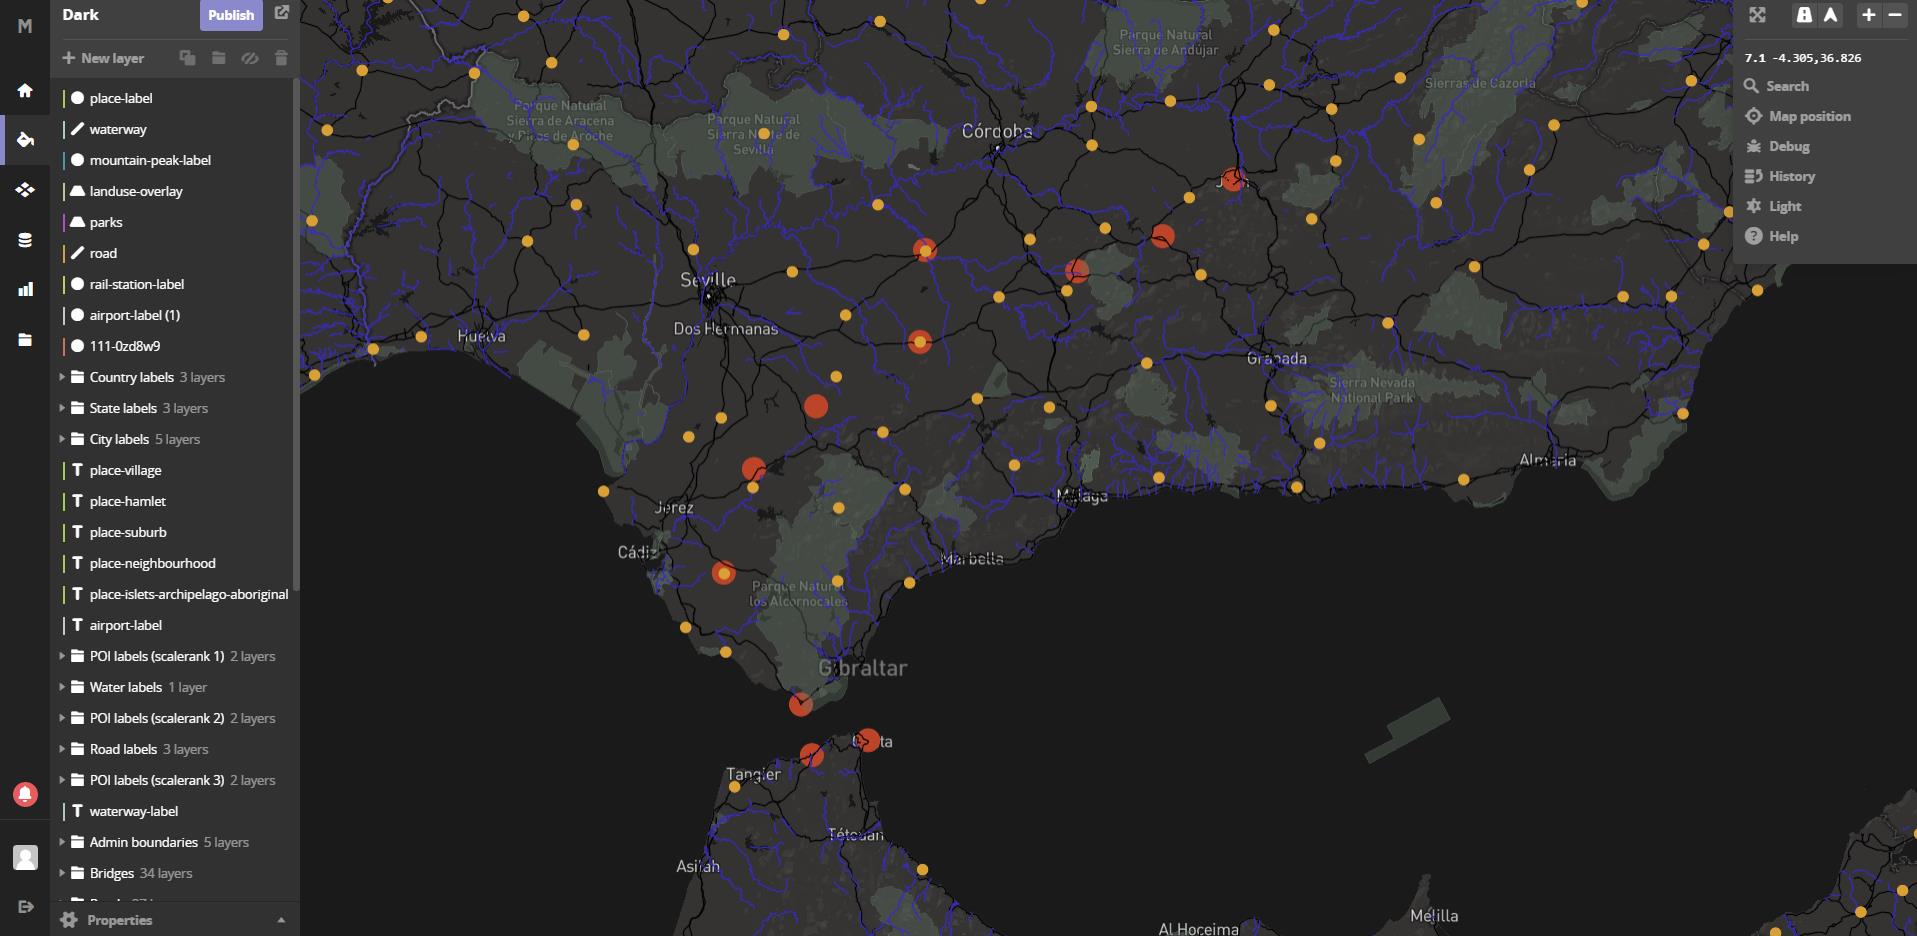
- The relationship between the present major road, waterway, and travel spots, to their location in antiquity. Maybe limited to those near current major roads.
- The relationship between thhe present-day village locations and the travel spot. Maybe Ibn Jubayr stayed nearby the town, or in a particular neighborhood in the town. Although we’re not sure the coordinate data is that precise, and may just code to the center of each town.
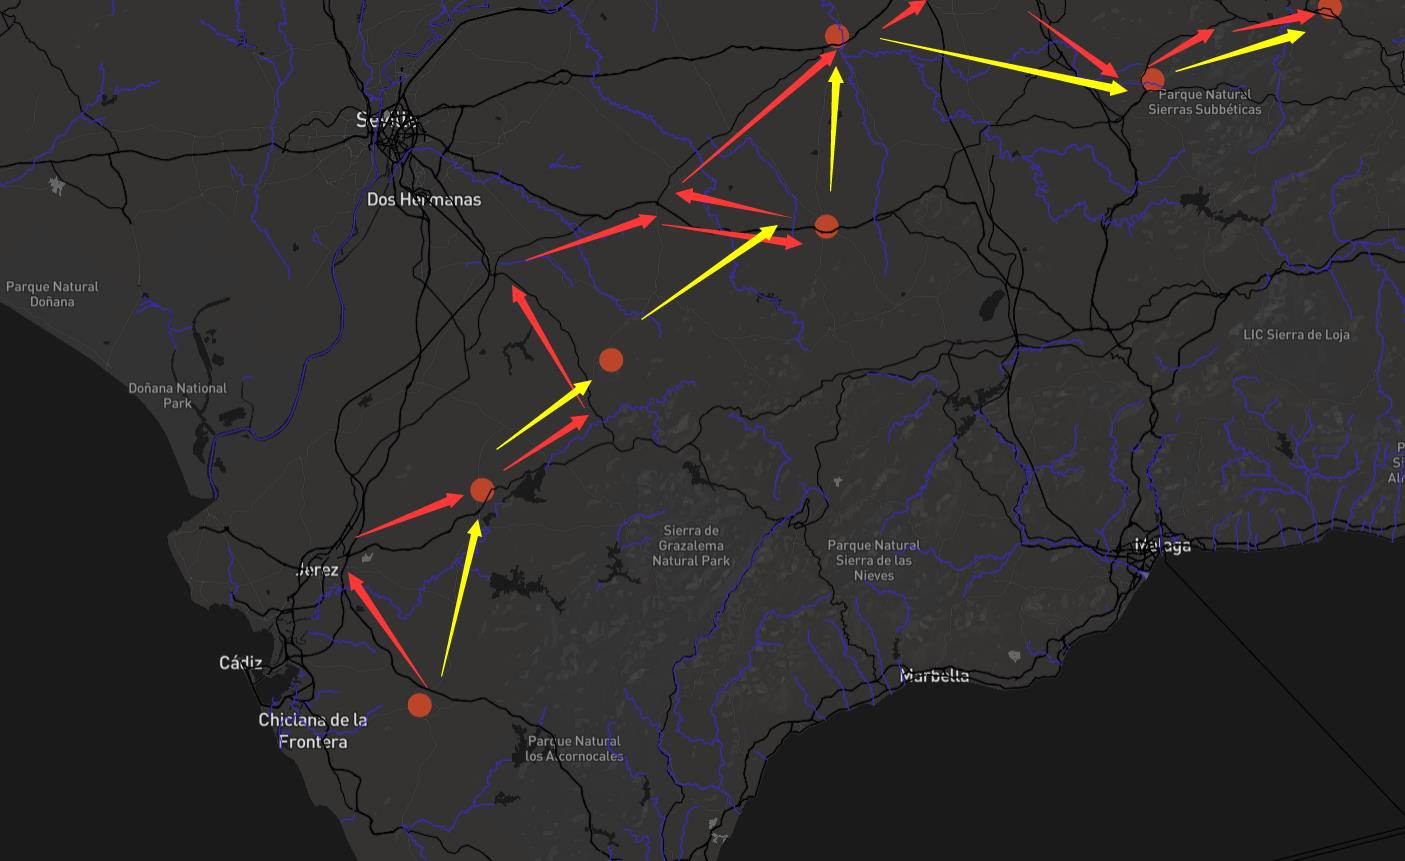
- Comparing the relationship between travel time then and now, based on estimated routes between the cities using today’s technologies. We can see if Jubayr’s rout is along the present major roads or a more direct way. How long would his trip take today?
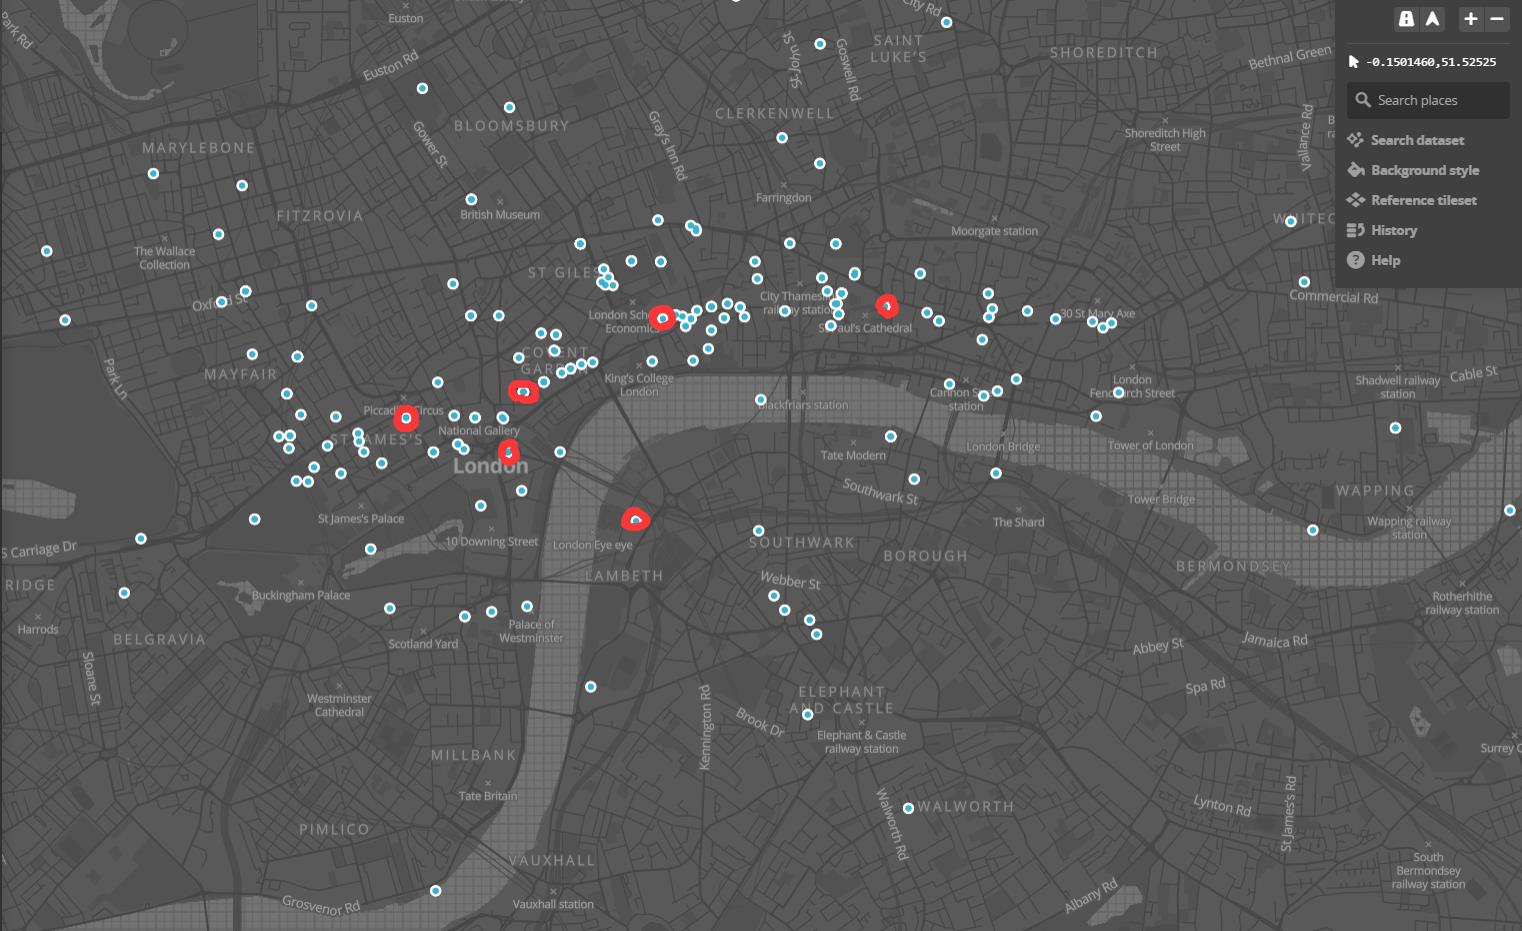
- If we can filter the entries to only include those for landmarks, we can see which landmarks Melville visited and how frequently.
- If we can filter the travel spots based on date, we could see his travel schedule (and an estimated quickest-route based on today’s roads) to see his travel schedule. How far would he have walked every day?
- if we can find the years that certain places were built or destroyed, we could highlight places he visited that no longer (or still) exist.
Technologies
- For maps, we will use some combination of Google Maps, Mapzen, and/or Leaflet for displaying points and routes. Both Mapzen and Google Maps have APIs for calculating routes between places using modern-day roads.
- For filtering and search of points, we will use custom javascript.
- Potentially, we will use one of the timeline tools we’ve discussed in class to allow a user to select ranges of dates or events, if necessary.