Miles & Ece CFRP (Wk 2)
Comédie Française Assignment, Week 2
Miles Osgood and Ece Turnator
The data from the various years of the Comédie Française record books, with their mixture of type and handwriting, defies OCR capabilities, so it’ll have to be entered manually. Even though we see pretty large variations in data format from year to year, we expect there would be certain consistencies within given seasons, so we’ll create different spreadsheet tabs for different sets of years that use the same accounting layout. Since we’re dealing with revenue and expenses, Excel seems like appropriate software to use. For the sake of other scholars, we’d try to be as comprehensive as possible in our inclusion of information, including extra columns to make note of miscellany and marginalia. Some extra columns will include codes so as to be able to do some comparative work among different years: e.g. 1L for “Premières Loges” tickets or equivalent.
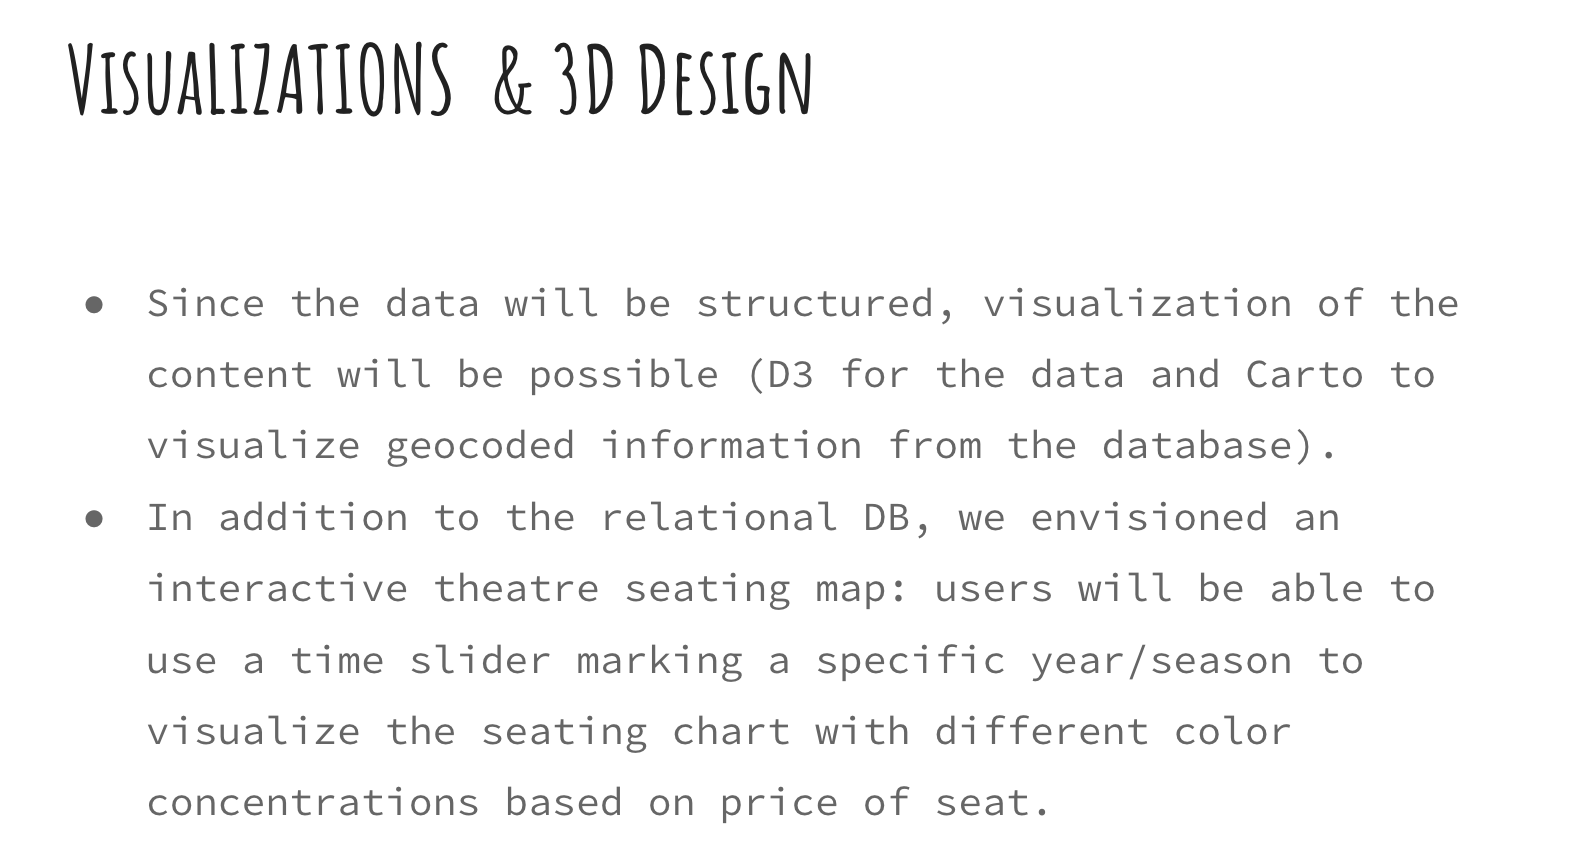
We’ve envisioned a different form of presentation for the public-facing dimension of this project. We expect that this audience would consist largely of students, teachers, and academics, but not ones necessarily working on the same period and the same problems. Using the data in the spreadsheet above and the codes to make certain variables consistent over the years, we plan to present an interactive theatre seating map on a website that shows attendance statistics in a visual format. Users will be able to use a slider to move through various years and seasons, and the seating chart will update with different sections lit up (depending on the layout of the theatre for that season) and different color concentrations depending on price and density of ticket sales. Users will be able to hover cursors over various theatre sections to see the actual figures. This should make the data more exciting to lay viewers, but it will also help researchers get a quick sense of certain trends or anomalies before following up in the details of the spreadsheet.
The motivating research question behind both the scholarly and the general-audience dimensions of this project is this: what was the relative importance of the repertoire or the year in the varying demographic composition of Comédie Française audiences over this span? We hope to see, for instance, whether demographic shifts occur gradually and predictably over the course of certain decades in line with what we’d expect from French Enlightenment-era history or whether other factors—the plays selected, for instance, or perhaps the layout of the theatre—are more important. As such, over time, we’d add more information to the website about relevant historical events or dramaturgical/literary background pertaining to the selected season.
Slides: https://docs.google.com/presentation/d/1qzDbC0cCZGca1_C2bnI7G-hACUuLX8AYa-WbPrBvl5I/edit#slide=id.p
Enter text in Markdown. Use the toolbar above, or click the ? button for formatting help.