Assignment 1: CFRP
The CFRP dataset is seemingly well-structured (all ticket sales were recorded using a template), extensive (100s of years), and interesting (the breakdown of sales by seat type and the accounting system used should allow for many different questions to be answered.) We think that that professional/academic researchers and history lovers would be interested in digging in further. Below is a deatiled analysis of how we would prepare this dataset for visualization such that this audience would be able to better understand this data.
Slides
Click here to view as a presentation.
Data acquisition and storage
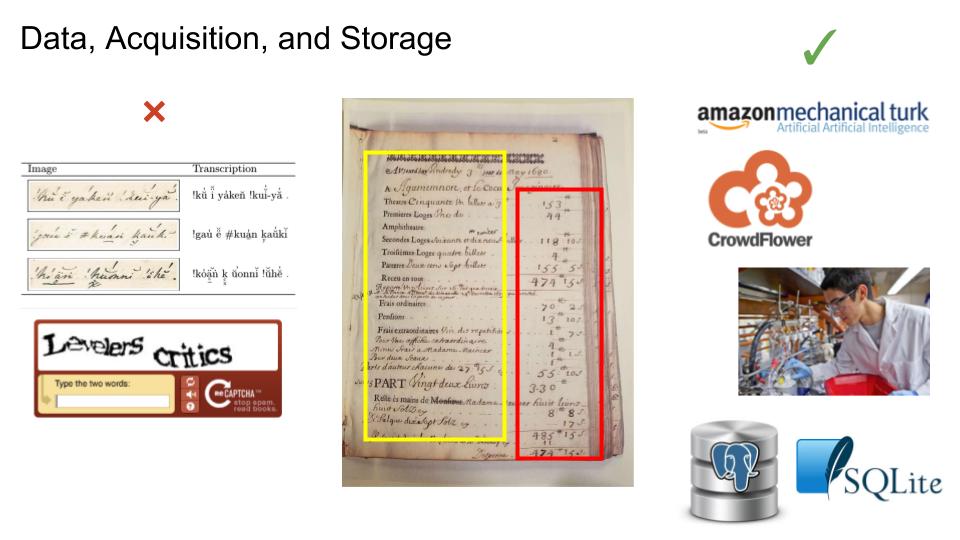
Despite the rough structure described above, the ticket sales records are still difficult to convert to a meaningful digital form. We would scan each page with a high-resolution camera, and store them as digital images, and extract the following information from each page:
- The file name of the image of the page
- The book from which the page came
- The page number in the book
- The data extracted from the page:
- Date
- Names of the plays performed
- Income - number of tickets sold at each price point - name/description of that price point (e.g., Ampitheatre) - price of that ticket - total income from this type of ticket - total number of sales of this type of ticket
- Expenses
- Total
- By category - By subcategory (if available)
We would also extract the following information from each book:
- Name of the theater whose sales are recorded in the book
- Any known GIS data about that theater
- The font or typeface of the template
Acquisition
How to do this? Despite being templated, each book has a different template, so we’ve designed the schema to reflect the superset of all the data made available in the books. But because of the data format in each page (handwriting, in cursive, from multiple different authors, as well as punctuation, numerals, and written numbers) it is unlikely that existing Optical Character Recognition programs will be able to extract usable data. There is some structure, so it’s feasible to use that to write a little form that can be filled in for each page in each book. But how to get someone to fill in this data?
One option is to build out a system similar to CAPTCHA and get website owners to install it. We can make humans transcribe our data as part of verifying that they are real people to other sites on the internet. But this would be difficult because it’s hard to build out that kind of system, and orthogonal to the research goals.
A more feasible option is to use a service like Crowdflower or Mechanical Turk and pay people a small amount of money to transcribe the data. Or, we could hire undergraduate researchers, and even better, pay them in credit hours!
Storage
We would store the data in a relational database like Postgres or Sqlite because they’re reliable and it’s easy to implement a reliable schema in them. Additionally, it would be easy to convert this representation into other representations if the need were to arise. The image files themselves would be stored in a large directory tree, with files named according to {bookNumber}/{bookNumber}-{pageNumber}.jpg. The reason to create a separate folder for each book is that computers can have trouble listing large numbers of files. The reason to still include the bookNumber in each file name is to ensure that each name is unique, making it easier to reference a specific file.
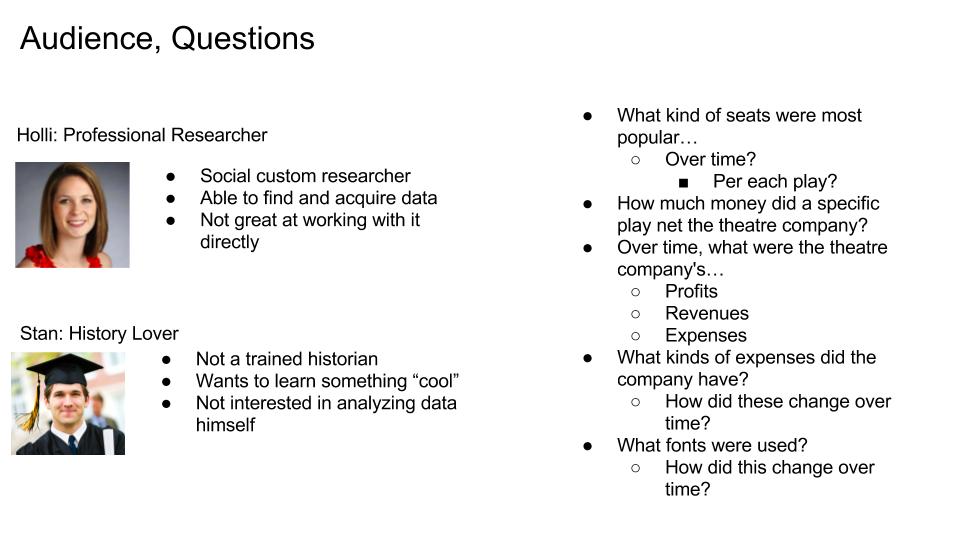
Target audience
We envision academic and professional researchers as our primary interested audience, although we think that maybe history lovers could also be interested. We think it’s unlikely that the general public will have a particular interest in this data set. Here are two example profiles:
Social Custom Researcher
Holli is 34 years old and works as a researcher studying social customs in France.
Key Characteristics:
- Familiar with using online sources to get access to information and data.
- Only has basic data processing skills, often finding it hard to collate data and visualize them outside of using a tool like Excel.
Goals:
- Getting the information faster and more conveniently than having to read through the pages herself
- Getting help in terms of data processing and data visualization
History Lover
Stan is a 22 year undergraduate student who loves history.
Key Characteristics:
- Interested in history since primary school
- Loving browsing fun facts about history on the internet.
Goals:
- Learning something new and having fun.
Questions, answers, and tools
Given the data that we will store in a machine-readable form, and the target audience of academic/professional researchers and history lovers, we think that it would be feasible to build a tool to answer questions in the following general categories:
- Social custom
- Economics of theatre in France
- Historical theatre culture
- Handwriting, fonts, and typewriter
For instance, some specific questions that we think could be answered:
- What kind of seats were most popular…
- Over time?
- Per each play?
- How much money did a specific play net the theatre company?
- Over time, what were the theatre company’s…
- Profits
- Revenues
- Expenses
- What kinds of expenses did the company have?
- How did these change over time?
- What fonts were used?
- How did this change over time?
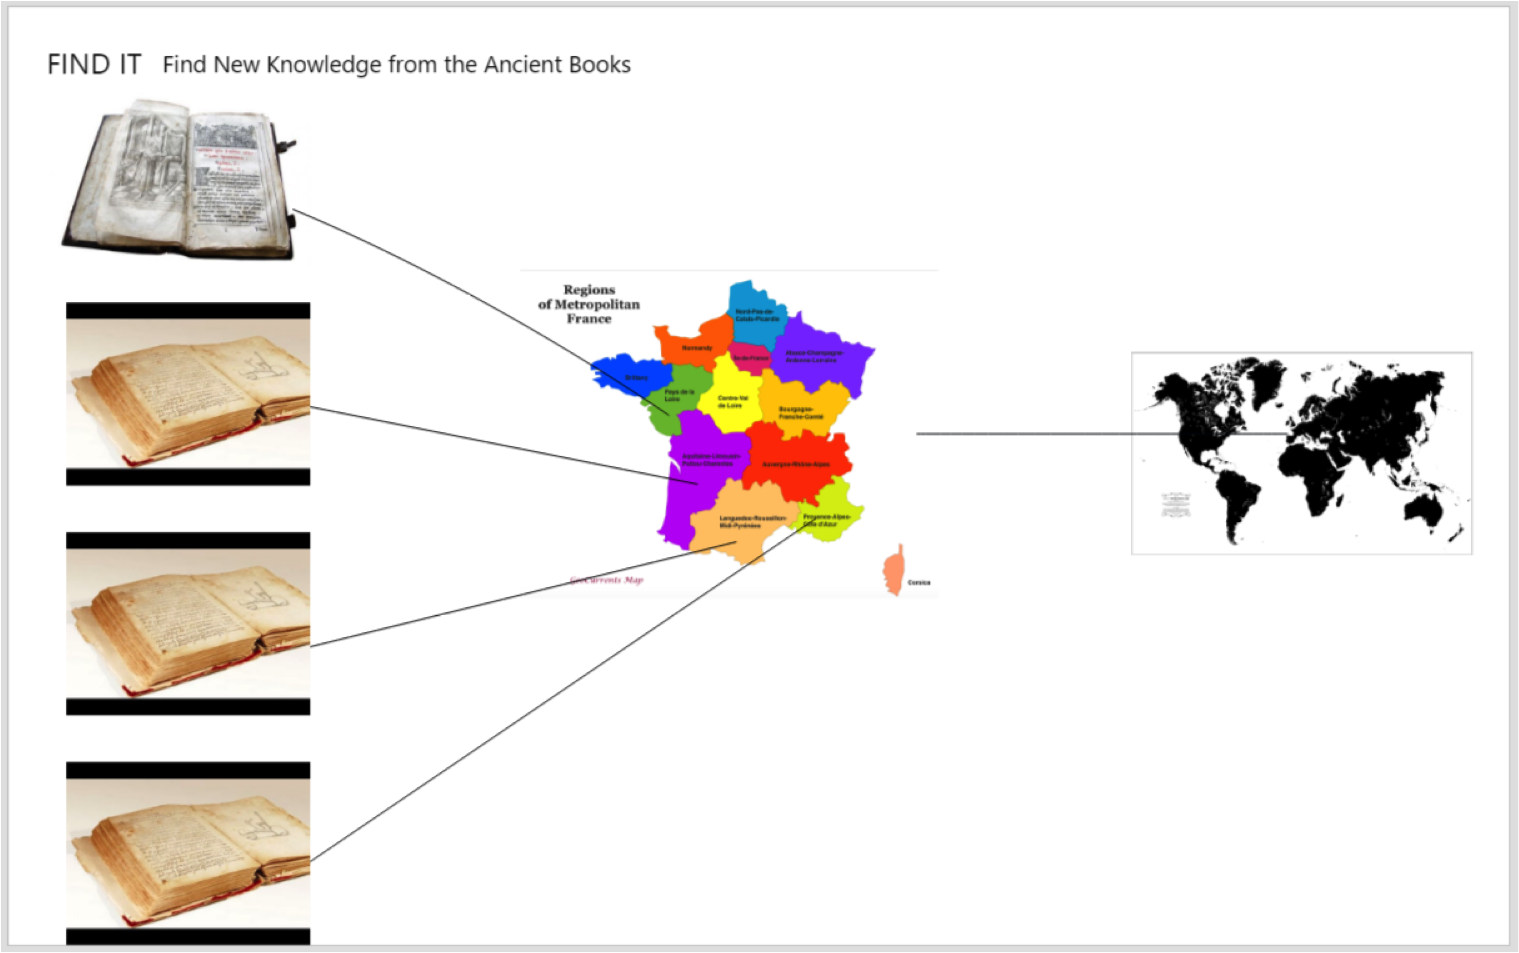
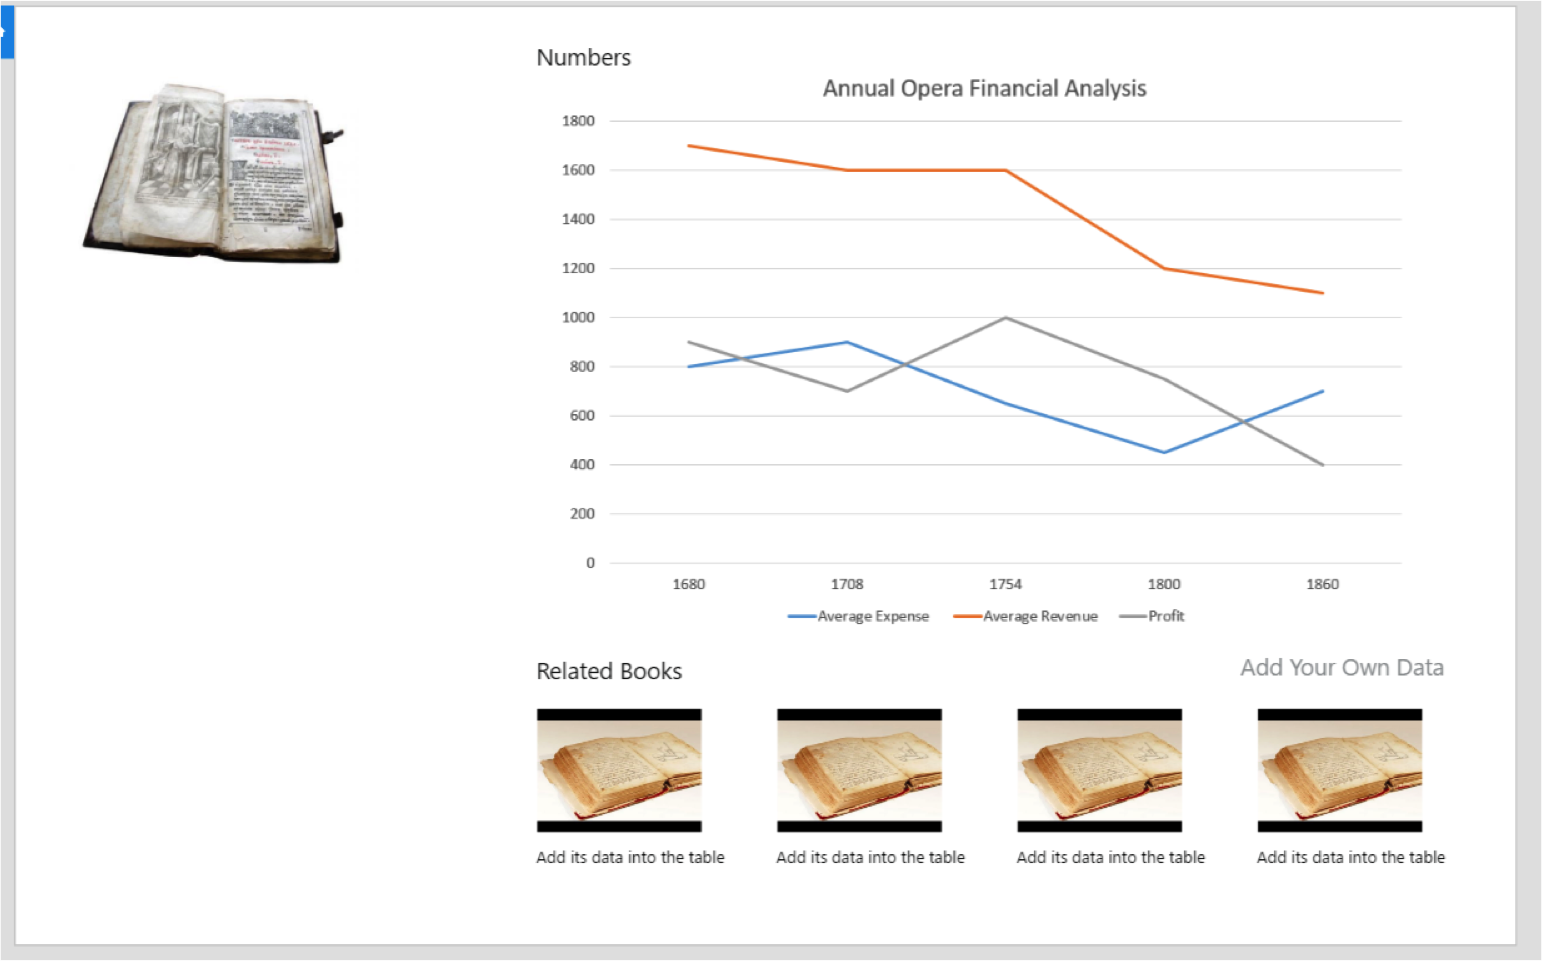
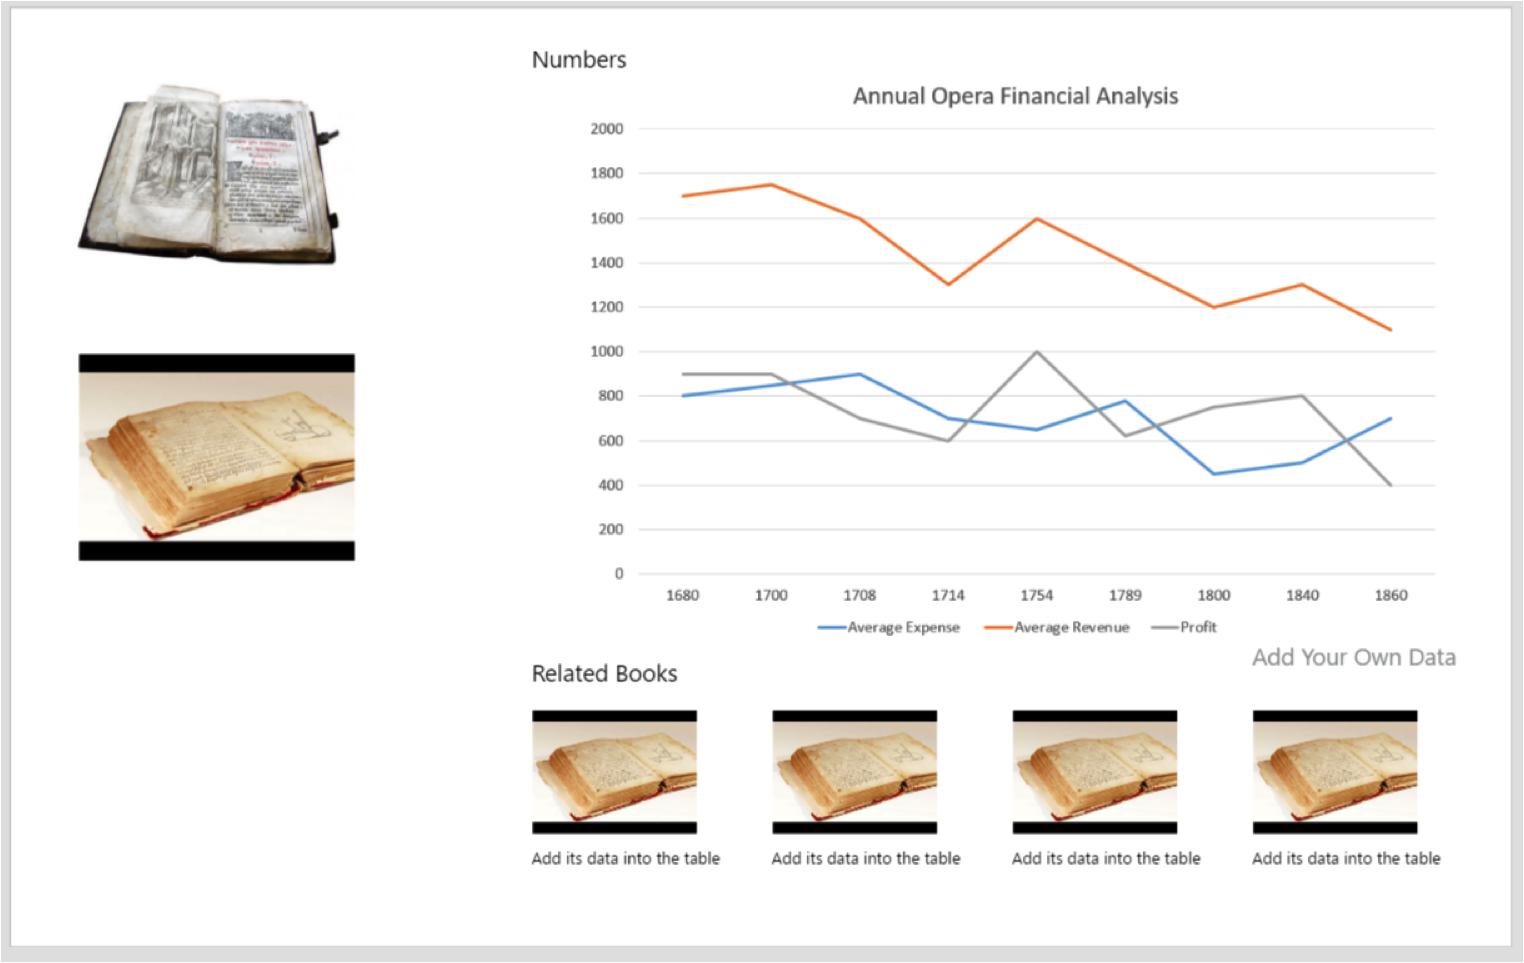
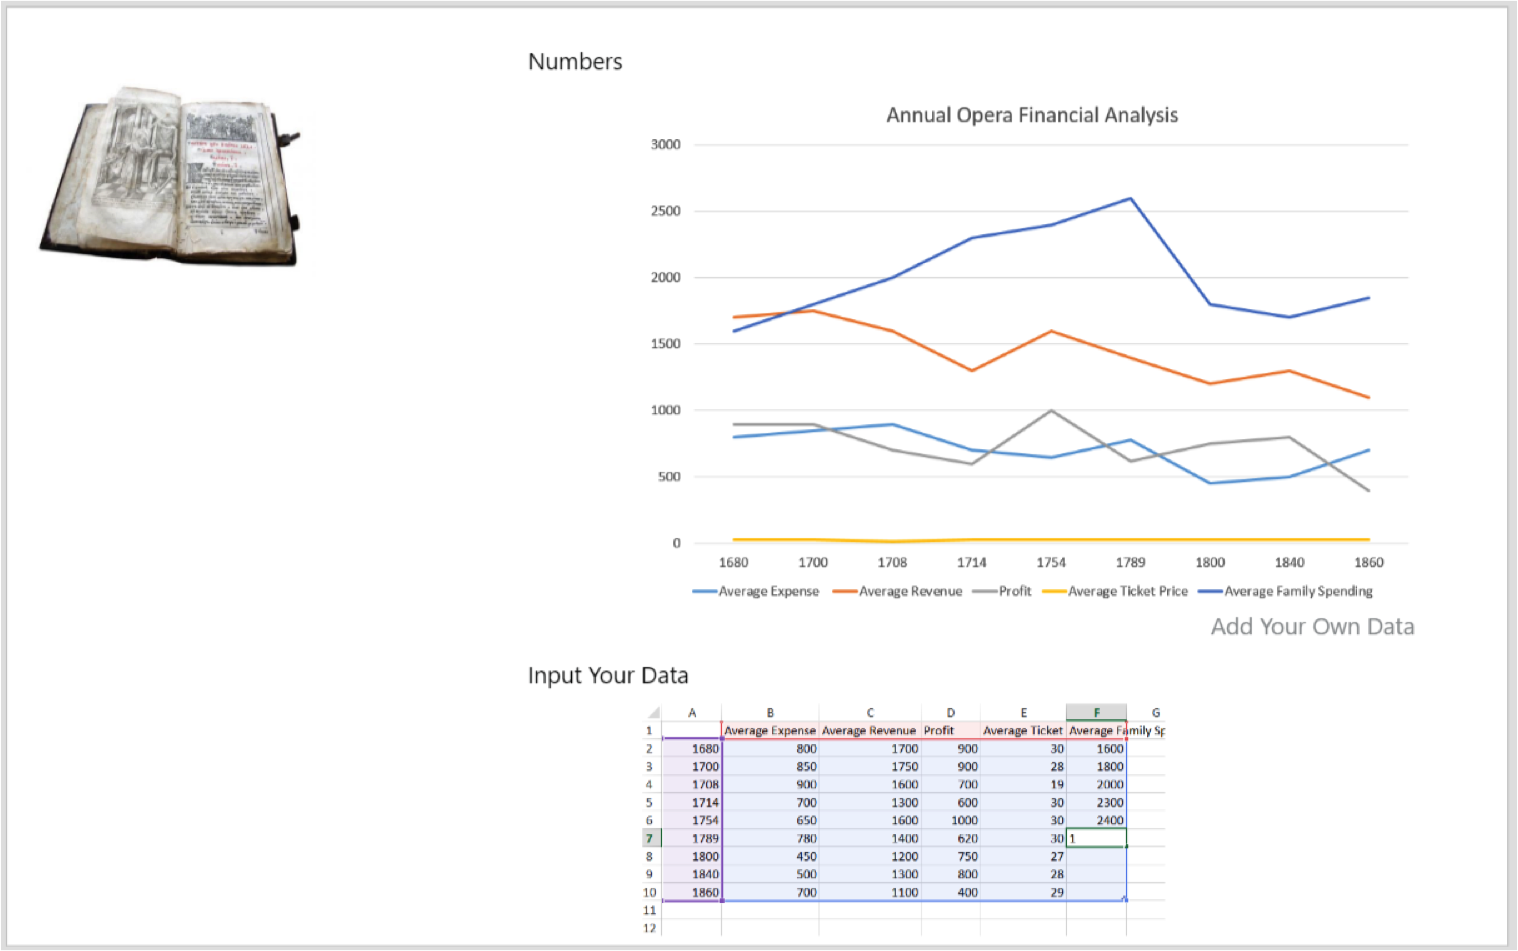
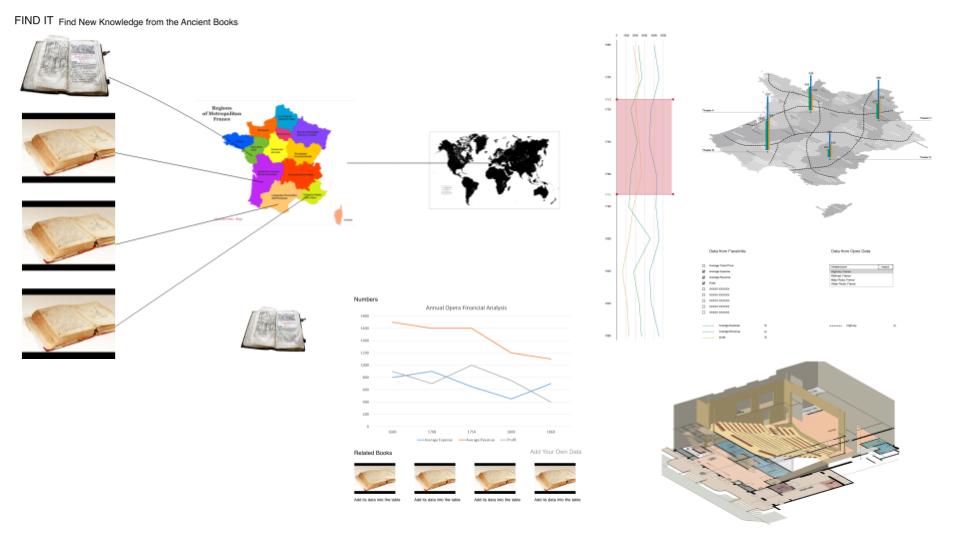
The tool to do this would be an online graphing tool, as shown below. We would also allow people to download the raw dataset – this would be most useful to the academic/professional researchers, although our tool is designed to answer the questions that we think they’d be most interested in.
Prototype