Narratives of Space and Time
I thought the Narratives of Space and Time was an interesting read. I especially liked how it included a lot of chart as references of the variety of ways space and time can be portrayed.
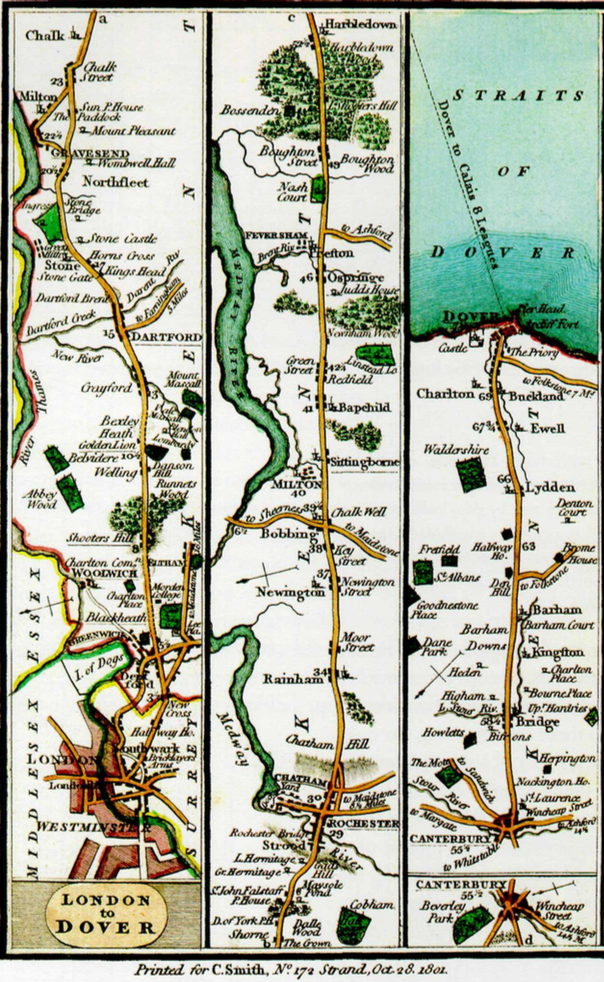
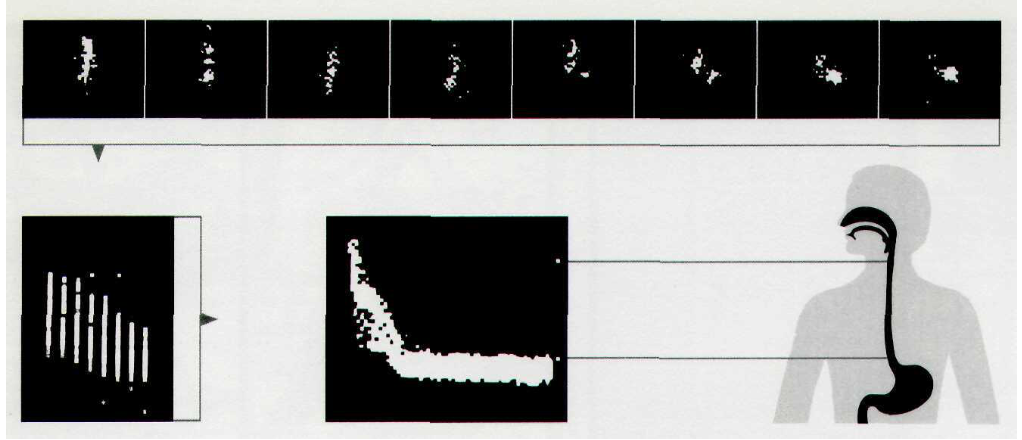
In this chapter, the author is trying to show how others in history have gone from “four-variable narrations of space and time onto flatland” (pg. 97). In order to do so two familiar designs are combined which are map and time-series. In order to introduce the topic, the author starts out with the Galileo’s “Starry Messenger” record observations of Jupiter’s moons then from there builds its way up into more complex designs like the road plans from London to Dover:

or the Esophagus timetable:

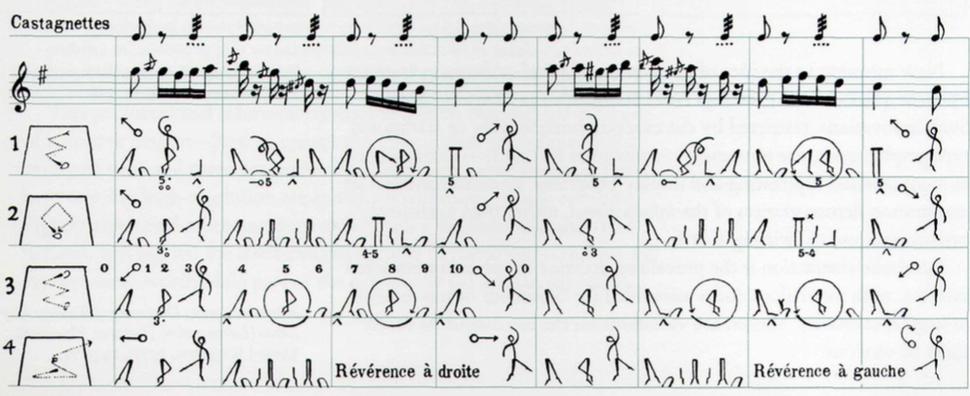
In any case, my favorite was actually the records of dance movements as seen below:

I believe these are extracts from the score Cachucha. I never really thought about portraying dance movements in such a way. I would think it especially difficult to portray them alongside the score since I expected it to be all cluttered and difficult to read. However, looking at the image above, you can see that it is not that bad at all. Most of the movements are fairly simple to make out and are evenly distributed enough to not make it seem overwhelming.
All of the graphs overall were really interesting. Some had finer details while others portrayed a simplified timetable like picture. In the end though, looking through the different charts made me realize how important it is in choosing designs to portray certain things in an attracting way. For example, it seems like time tables work well for railway station scheduling or if you wanted to be more creative you could use a chart like the one below for an airplane schedule.

There are so many ideas and designs which you can do and I think what the author is also trying to get at here by putting all of these different examples is that it also matters what it is you’re trying to portray.