Mood Map Update
We’ve been working on the backend of our mood map visualization web app. We now have a database to store the user input with a simple slider to input data that we will use in the event that we don’t have time to implement the prettier sliders. We’ve also worked on the setup for the visualization of the data: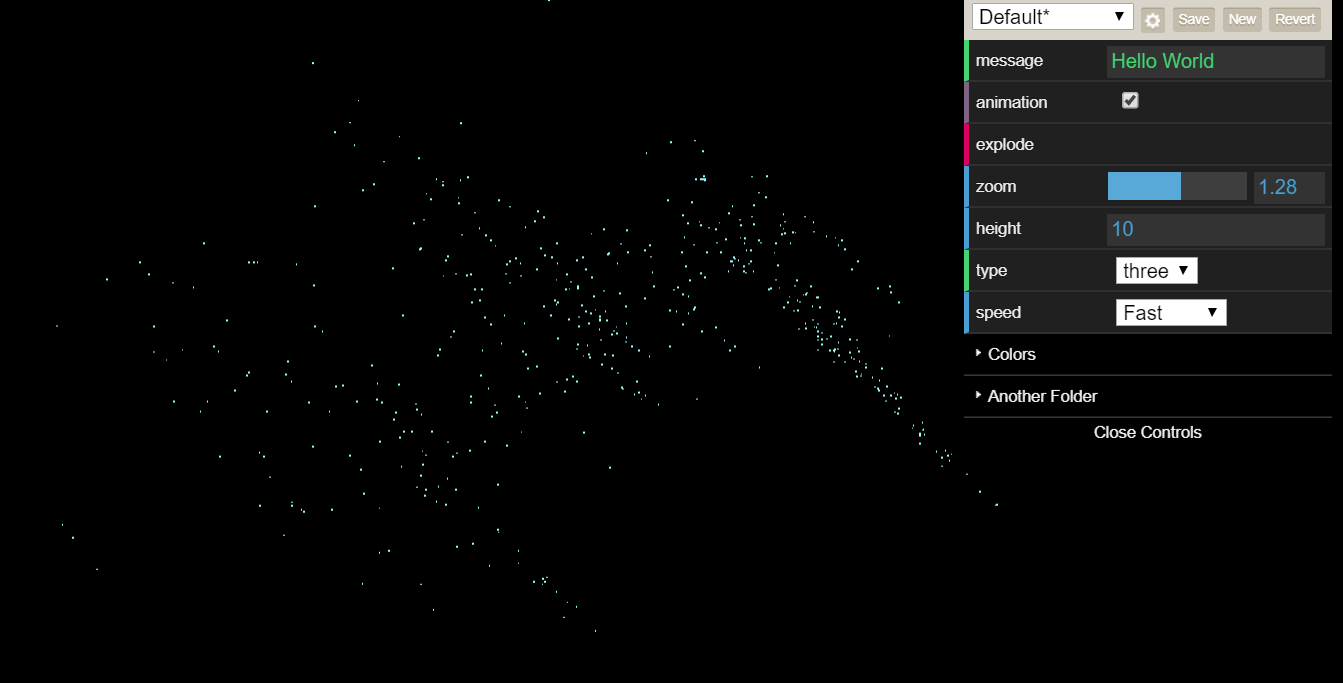 The input buttons allow the user to rotate the point clusters, zoom in/out, and change some settings for the visualizations.