Moby Dick Data Using Google Fusion Tables
After using the given instructions to input the Moby Dick data I changed around different settings to see what would happen. Generally speaking, I found that the Fusion tables convenient and useful for visualizing spatial data. The bucketing and heatmap features were particularly helpful, as was the option of editing the info window.
However, there were a few things that could be changed. For example, the bucketing mechanism isn’t intuitive, and it reverse changes isn’t a straightforward process. Additionally, the need to change columns when editing info windows seems impractical.
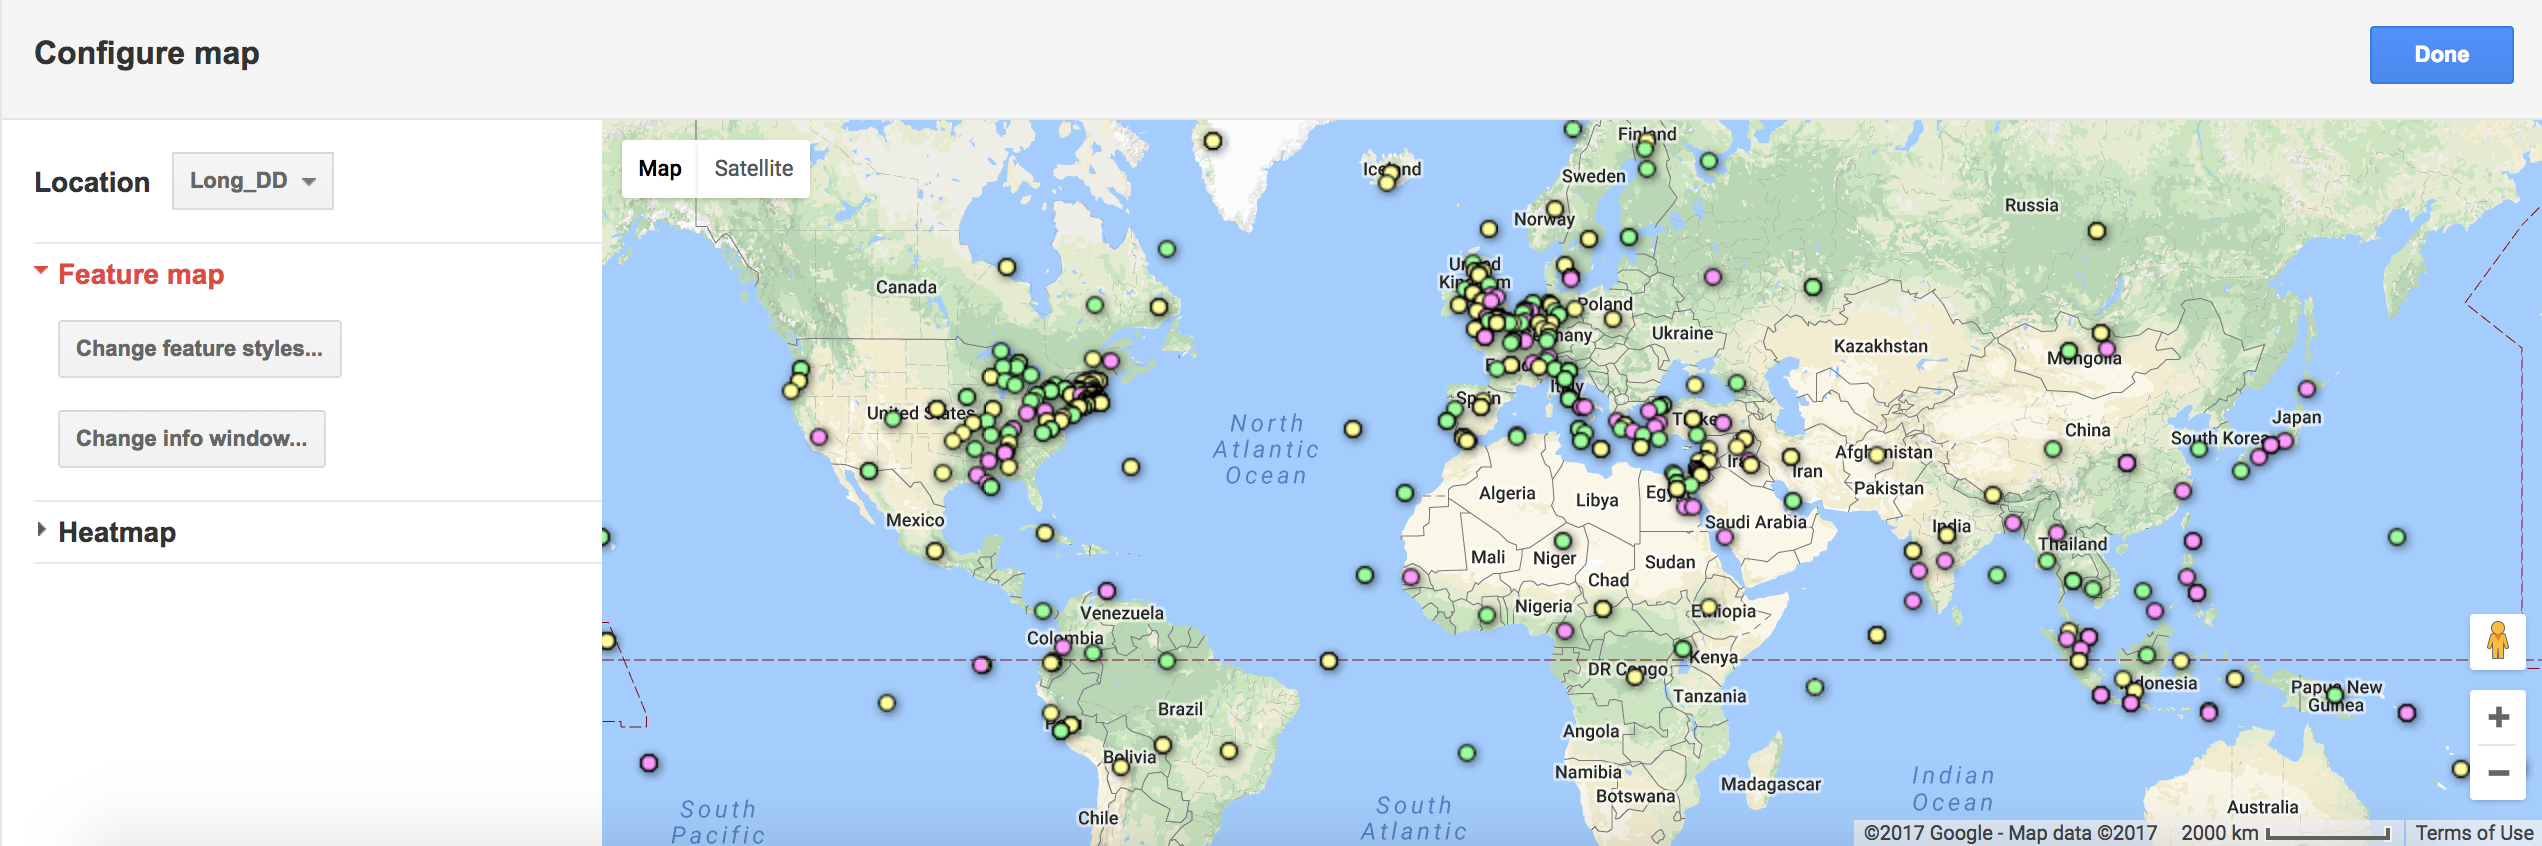
Bucketed Data
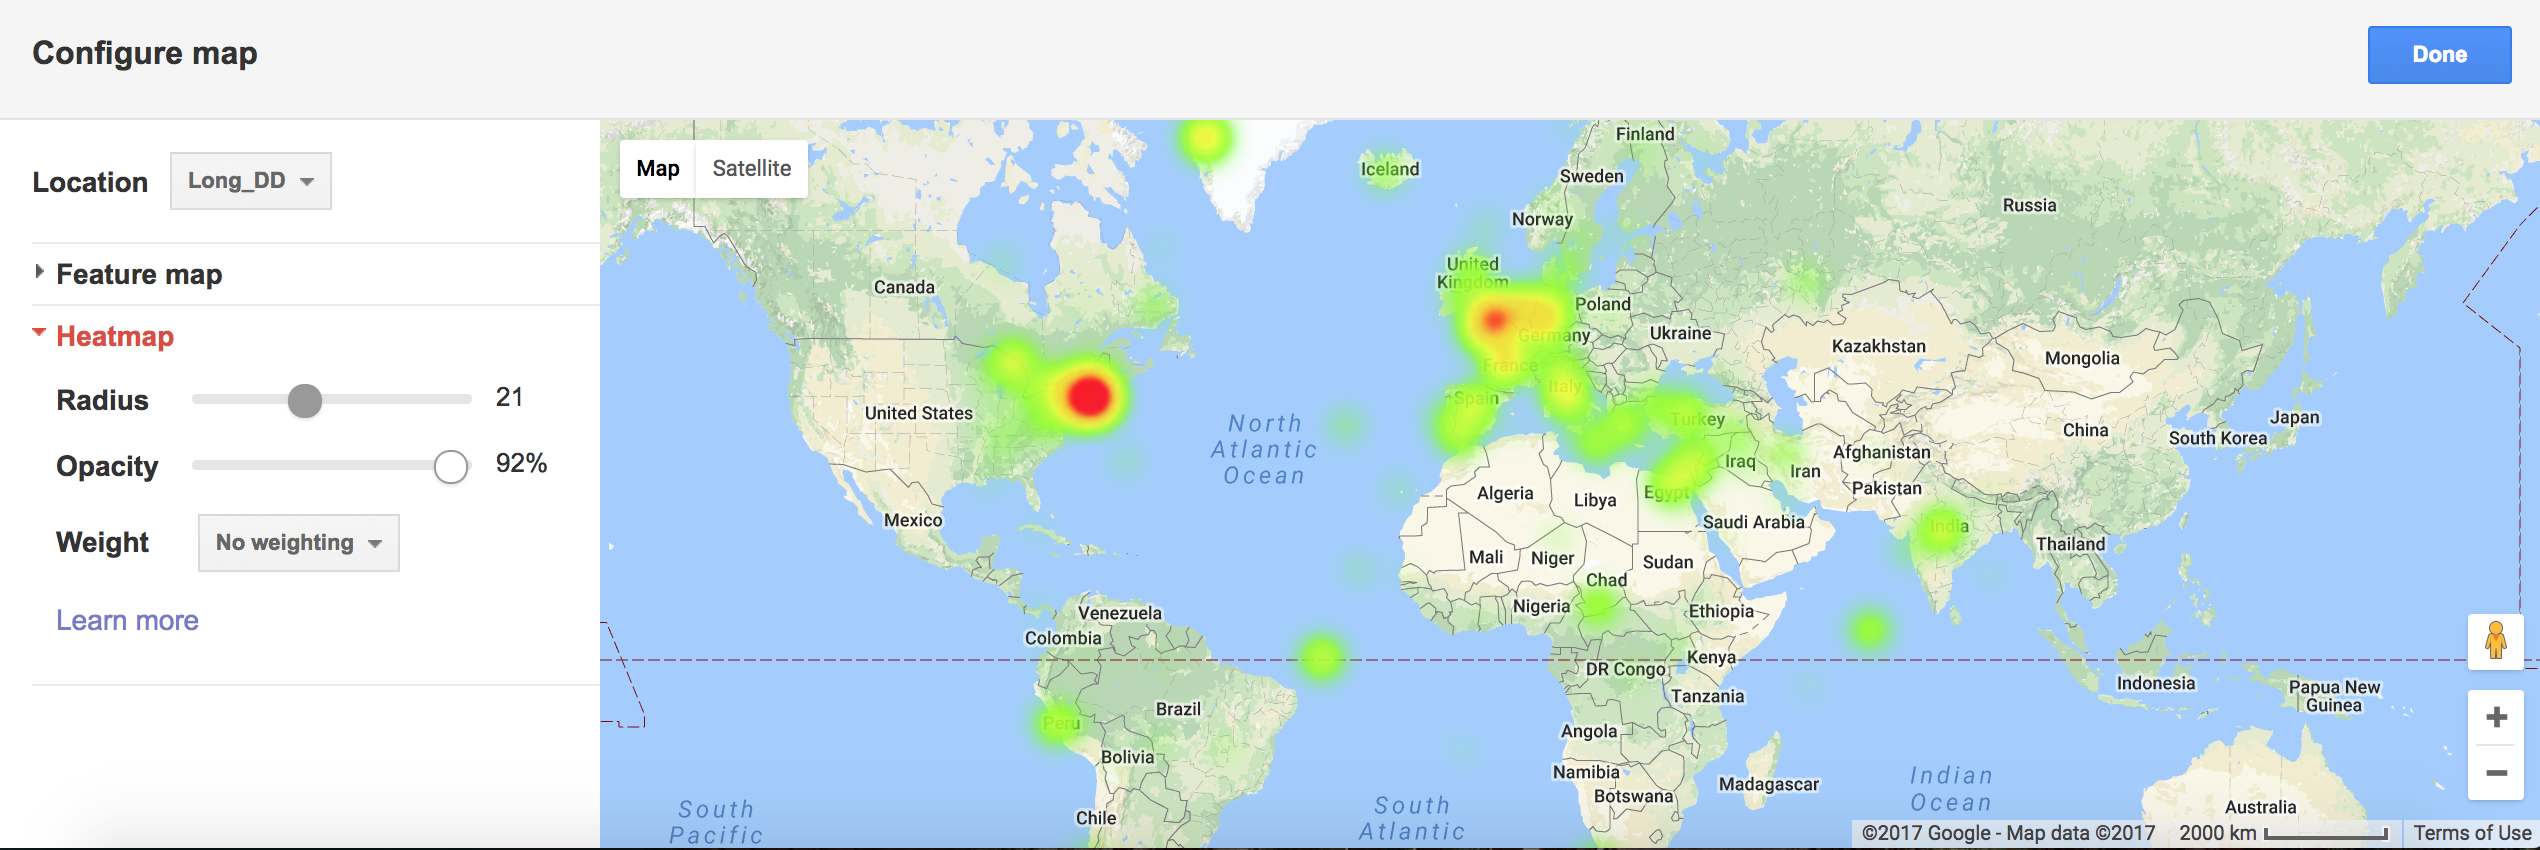
Heatmap
It would be interesting if the relationships between and types of data points could somehow be represented, whether by differentiating point styles or somehow connecting them.