Facsimile Ticketmaster Updates
When going through the CFRP data, we were fortunate to find that it almost supported our envisioned product. The only problem: there weren’t exact numbers of tickets sold–only associated revenues by section.
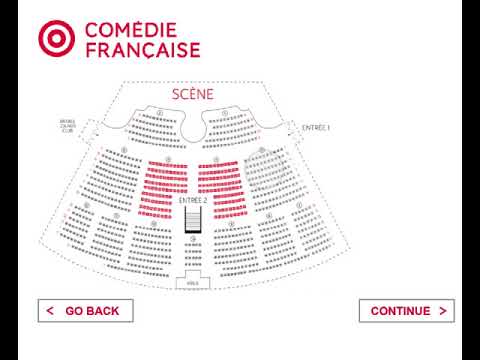
Since displaying a “ticketmaster-like” scene was important to us, we found that we could fairly accurately estimate the ticket sales by finding nearby maximum revenues, and associating them with “full section” statuses, and then figuring out the fraction of seats sold (and therefore remaining as well). This allowed us to complete our product exactly the same, using the following API requests:
- Select a Language -> Built in (No API Request)
- Select a Date -> Display dates from 1680 onward (No API Request)
- Display Shows on Date (request to http://api.cfregisters.org/play_ticket_sales?&date=eq.{date} http://api.cfregisters.org/play_ticket_sales?&date=eq.1776-07-04 for 1776-07-04, for instance) and aggregate by “title” field.
- Select a Show
- Display tickets for that show (request to http://api.cfregisters.org/play_ticket_sales?&date=eq.{date}&title=eq.{title} http://api.cfregisters.org/play_ticket_sales?&date=eq.1776-07-04&title=eq.M%C3%A9lanide for showings of Mélanide for example) on ticketmaster chart
- Select a Ticket, and print it
We recorded our prototype here:
For more information on how the story came together, see our previous post on Facsimile Ticketmaster!