Assignment 5
melville_in_london Map
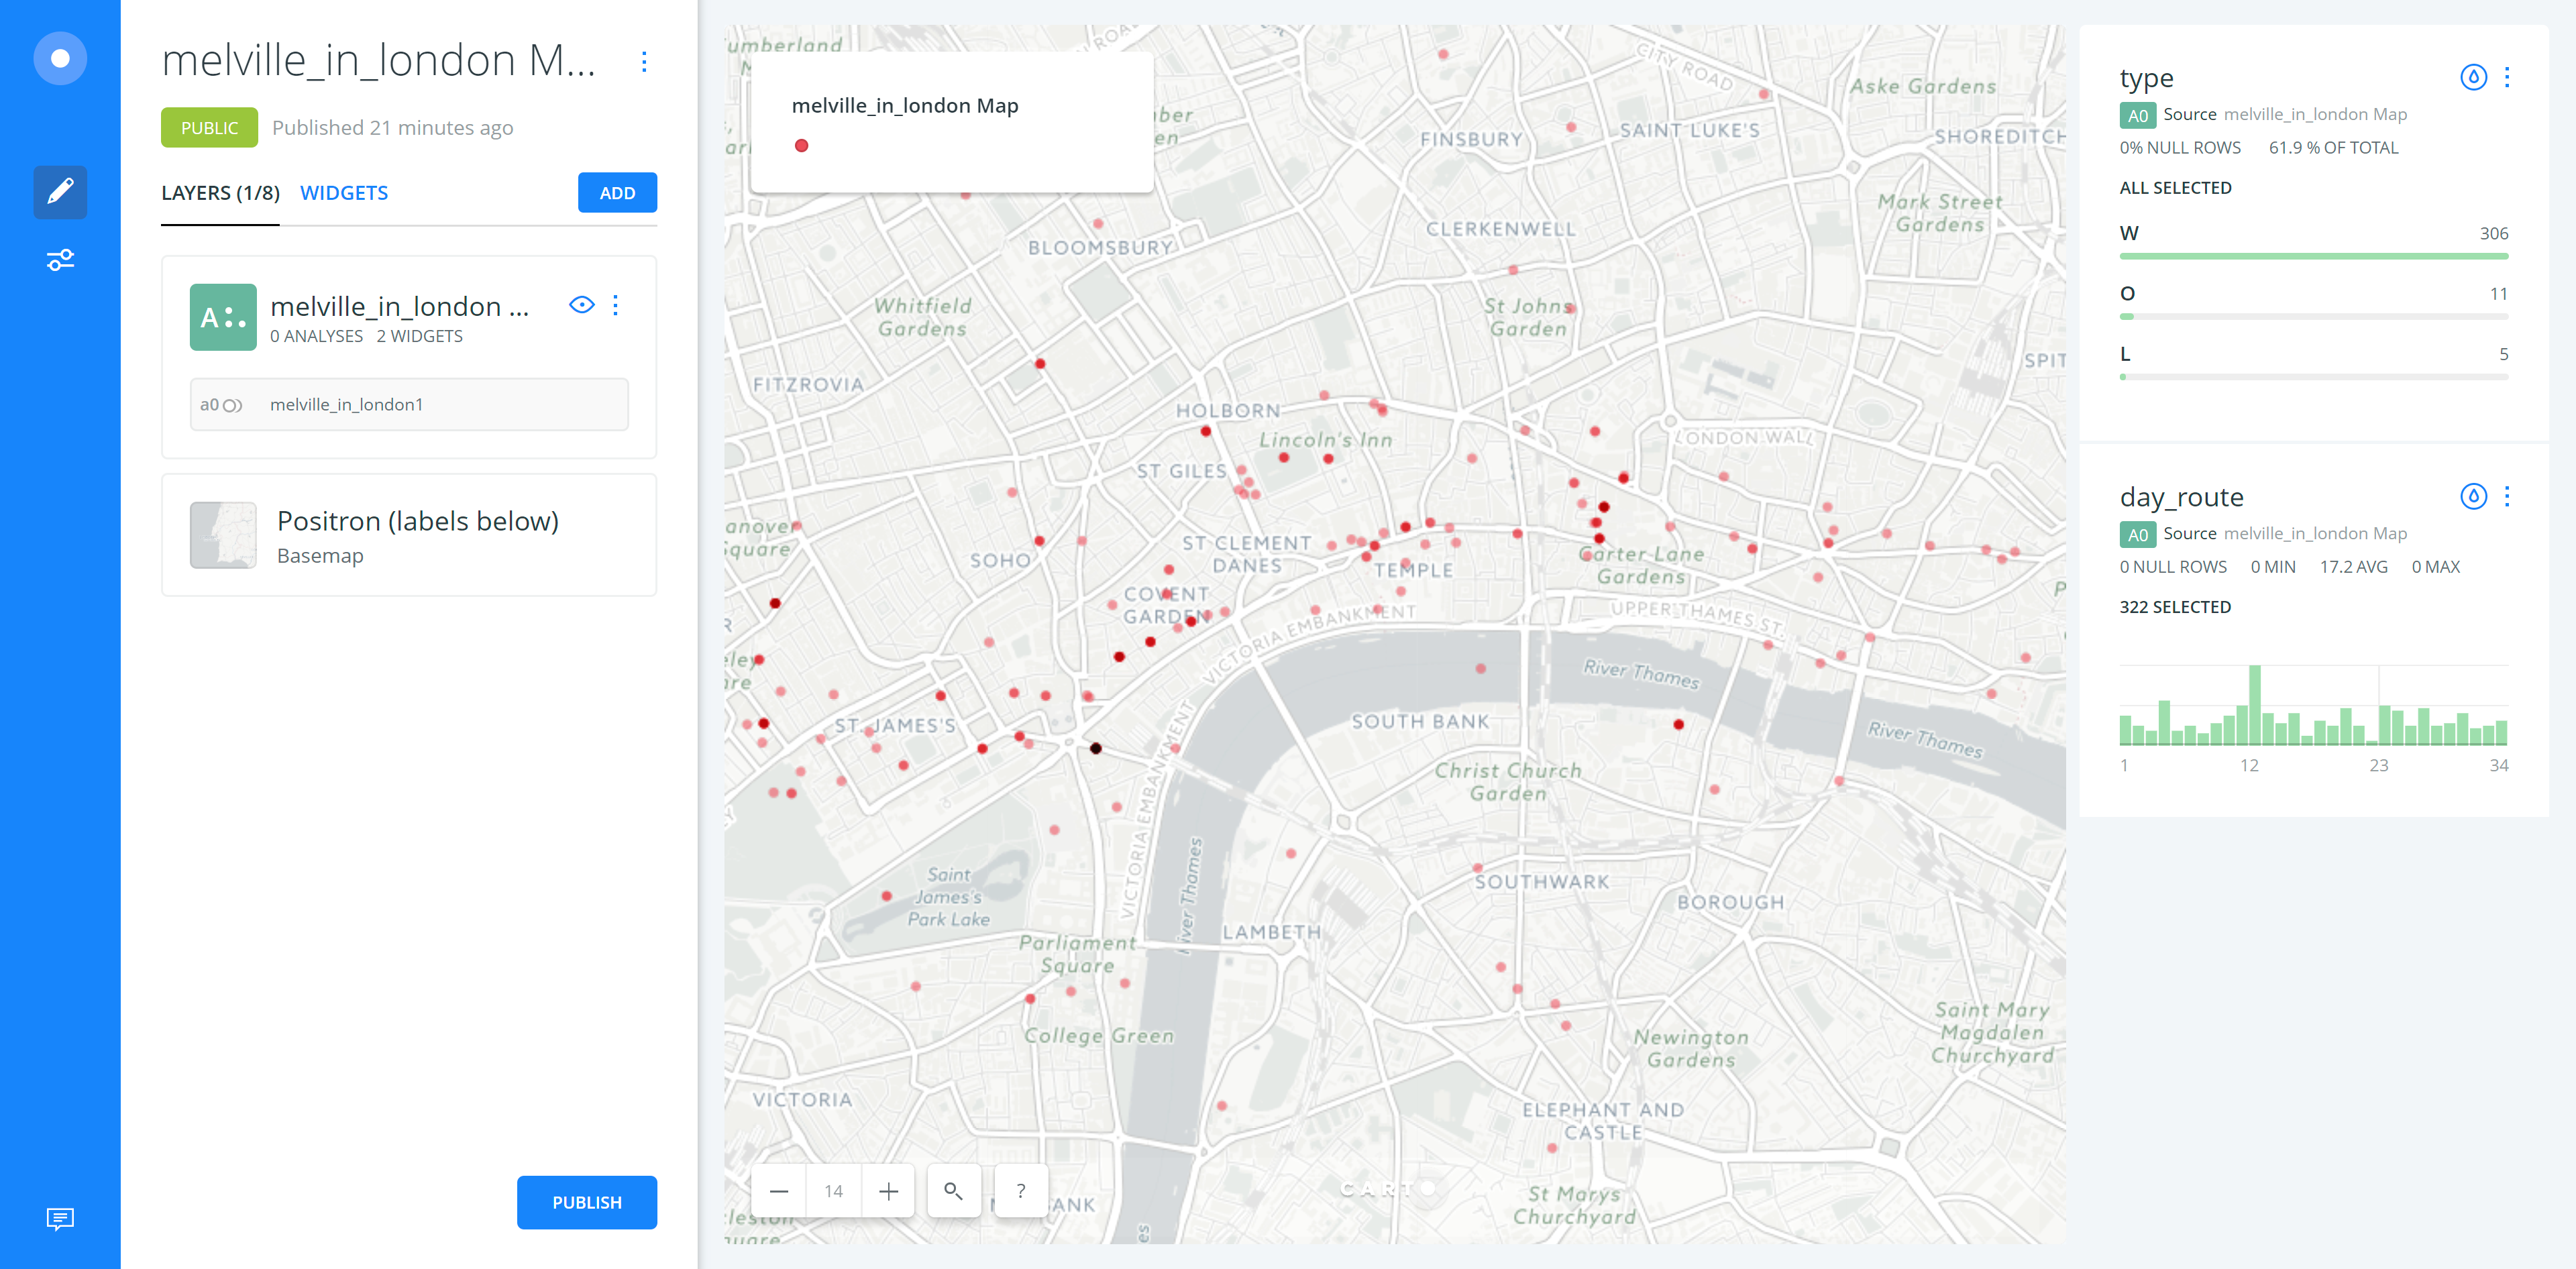
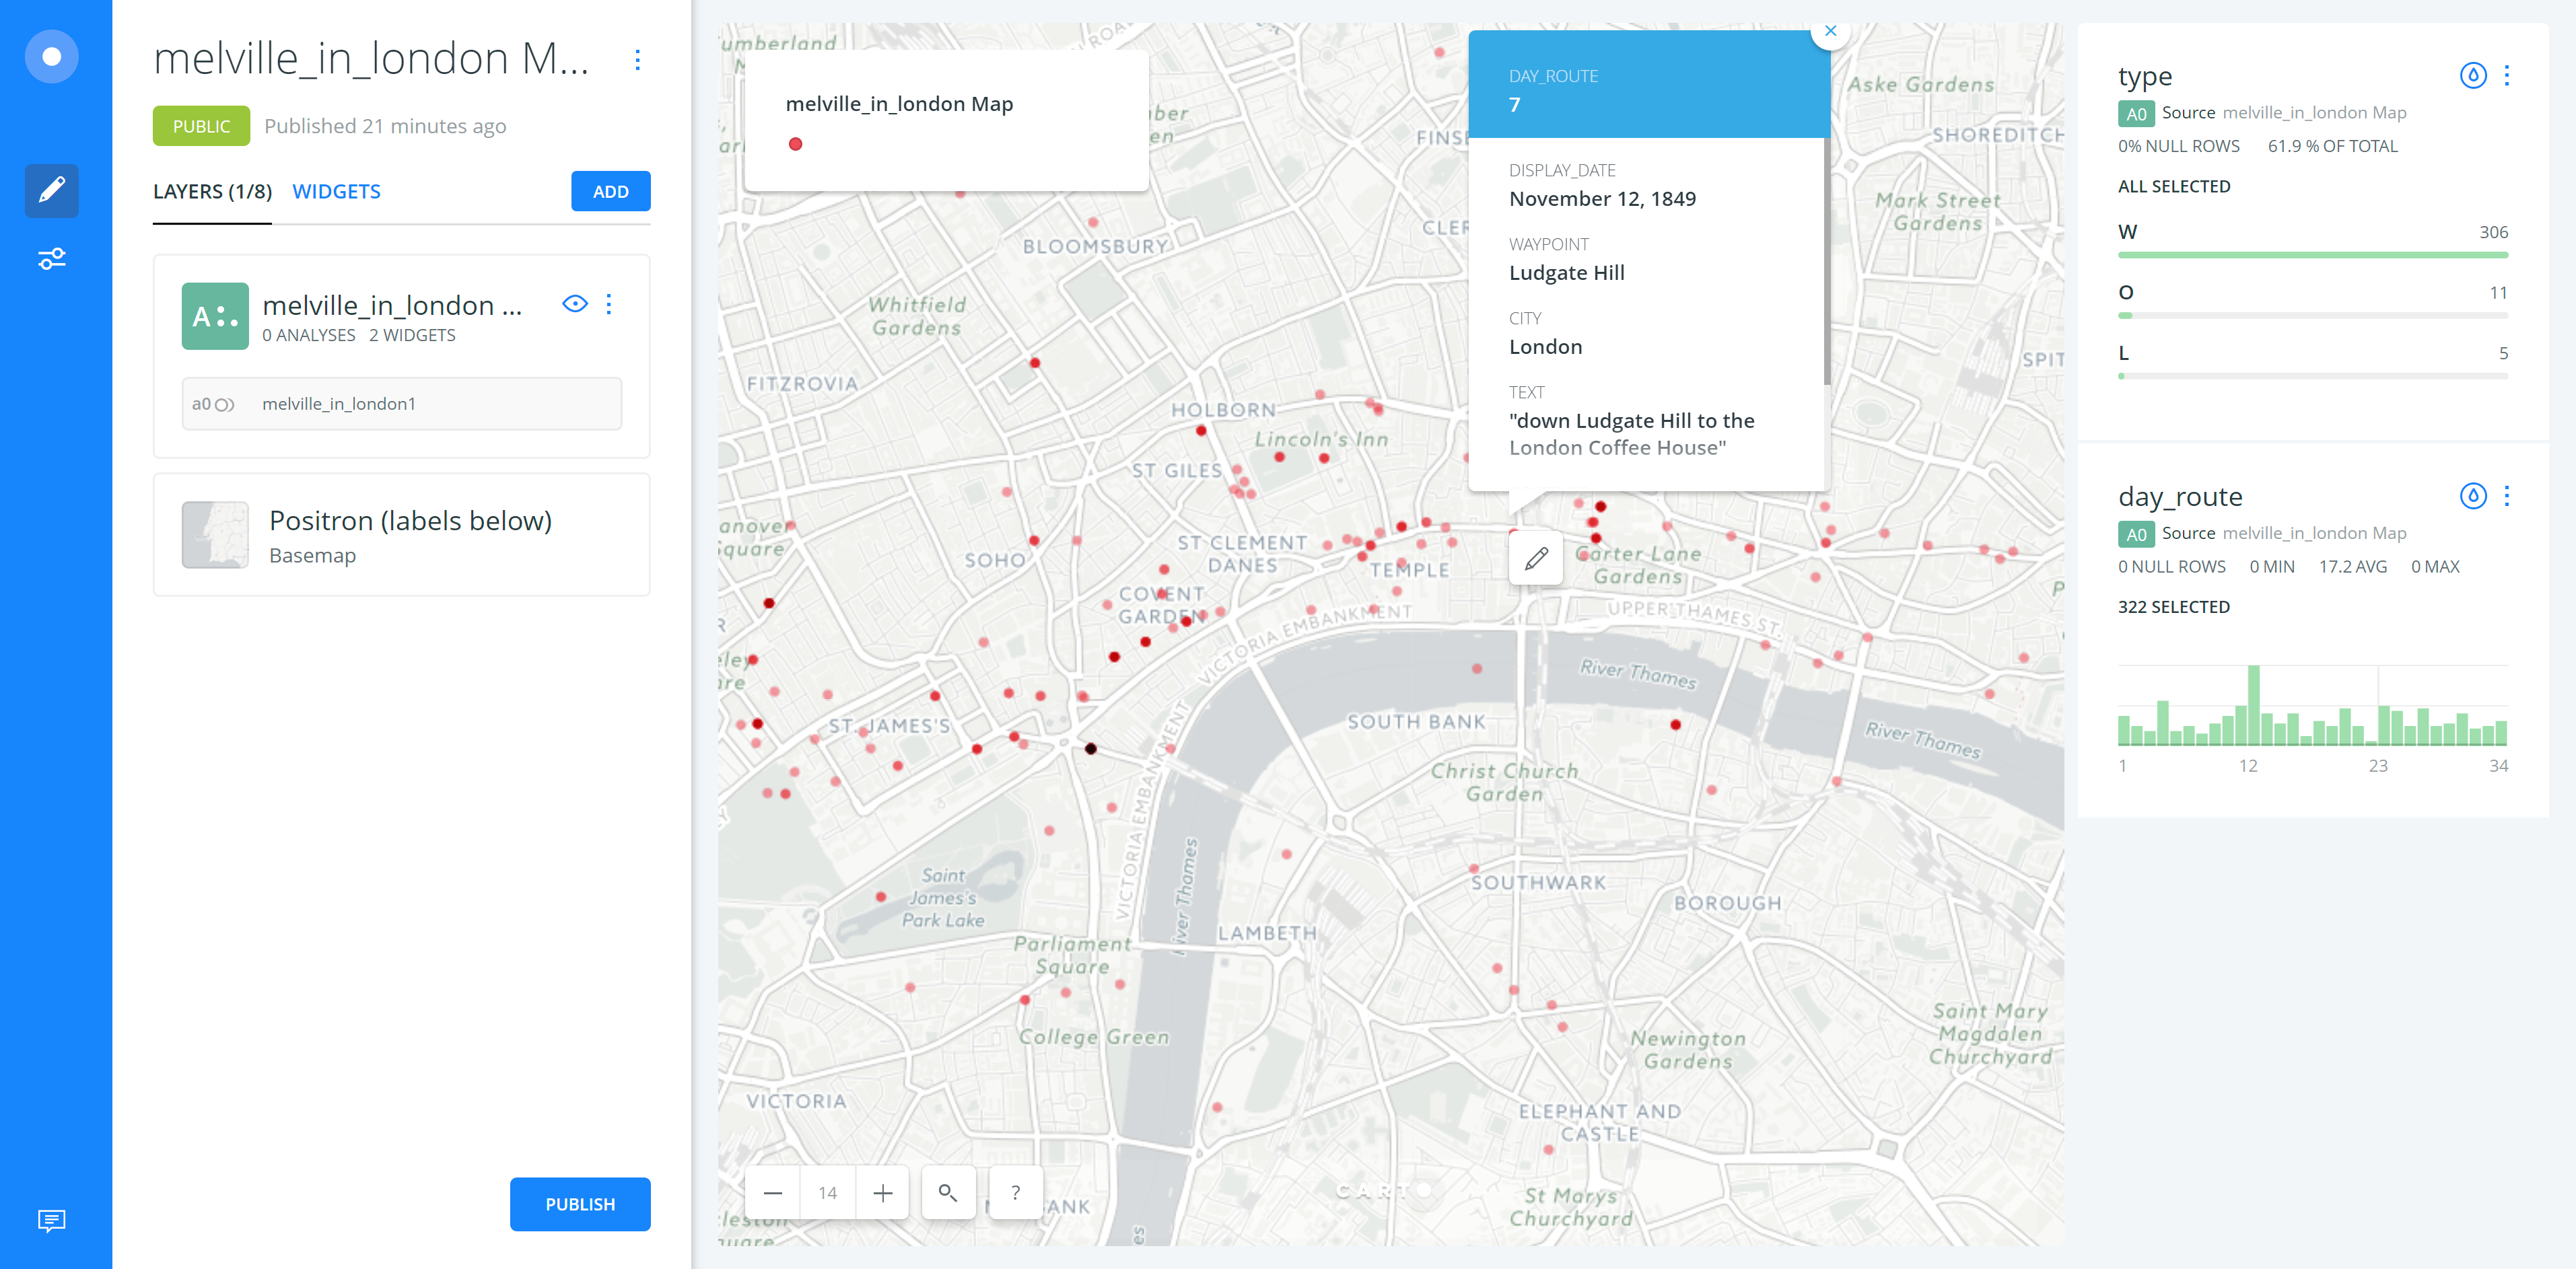
For this assignment, I chose to use melville_in_london data with Carto which has well-designed user interface. But I haven’t figured out how to change the base map into historical map. In this exercise, I used transparent dots to show the spots where Melville has visited and the layering weight would represent where Melville most traveled to. In the dynamic live map which has been shown in the video, the transformation of spots has been visualized. But I couldn’t represent the transportation methods which Melville has chosen. In the more general map, I used the widget tool to get the information chart of type and day_route. In the day route chart, we can clearly noticed which day or route he has visited most spots. And also, when we added the selection layer of day route, we can see the route in specific day rather than exploring all the information. The click-on pop-up info chart is also helpful. My suggestion for improving the Carto tool is that it should allow users to add on their own maps and make the manual functions more reasonable.
https://drive.google.com/open?id=0B20fOTX11unaZ0o4NDd0WkFNa0U
Dynamic Map