Assignment 3
Hidden stories
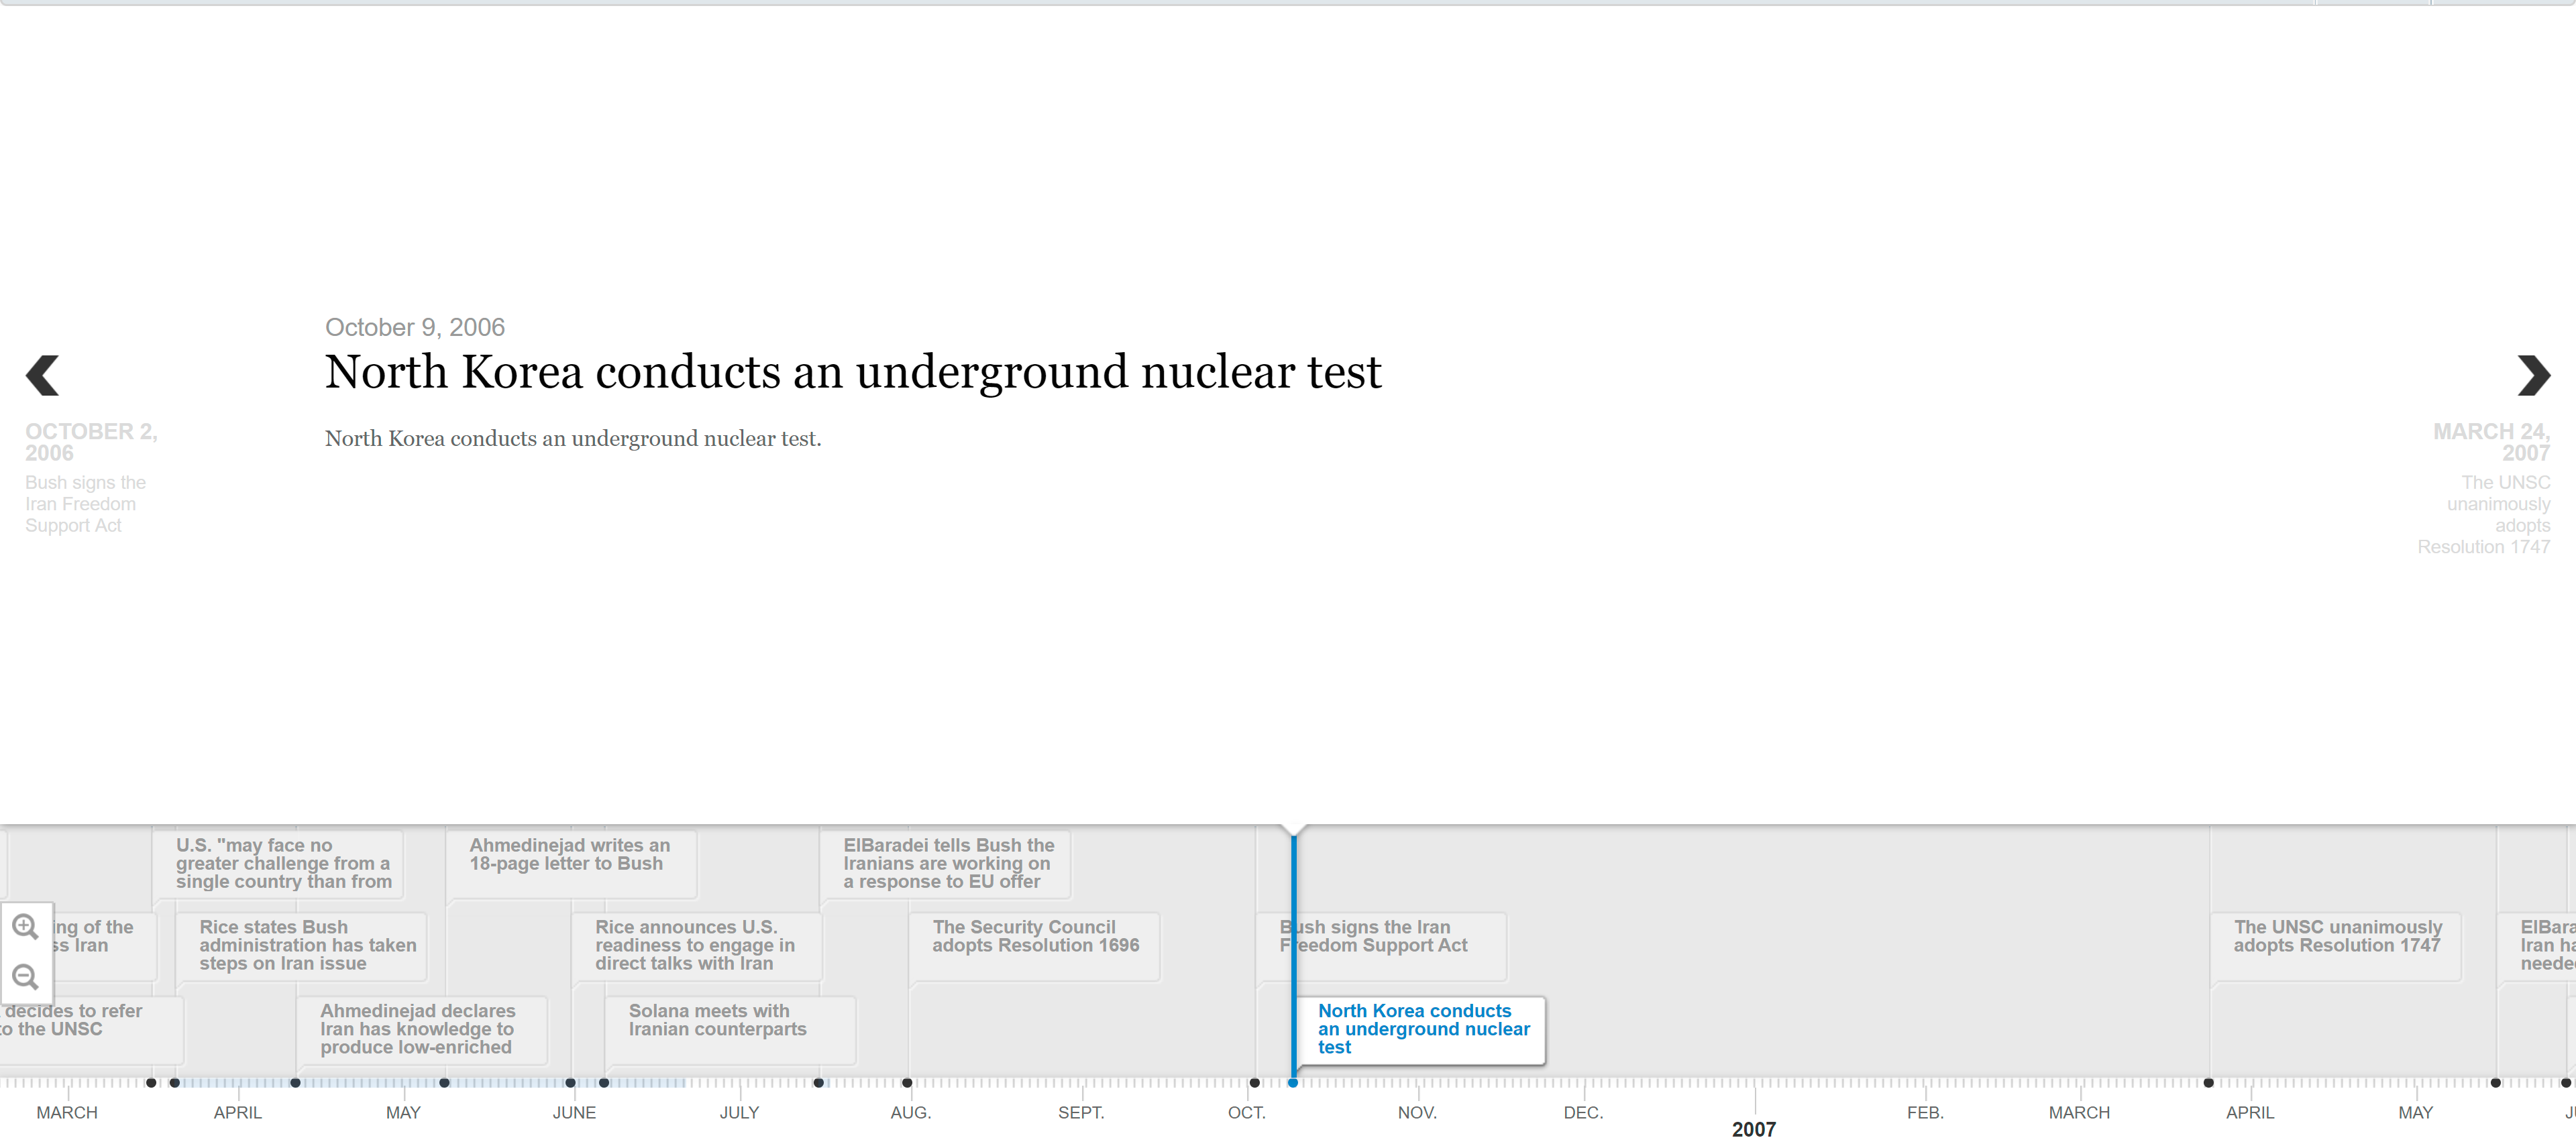
In this exercise, I chose to use Time Mapper as the tool to visualize 4th briefing data. In this timeline, there are a lot of interactions between US and Iran which are also represented in density. Although the web is clear and beautiful, I still want to add different colors to differentiate the two players. Also, one thing I found interesting is that countries other than the two actors have shown their attitudes and generated their own stories during the same process. If we can connect the nuclear tests in North Korea in 2006 and today, then would the same story happened in Iran replay?