Assignment 3: US-Iran Relations Display
I used Microsoft’s timeline storyteller tool to look at the 3rd Briefing Book.
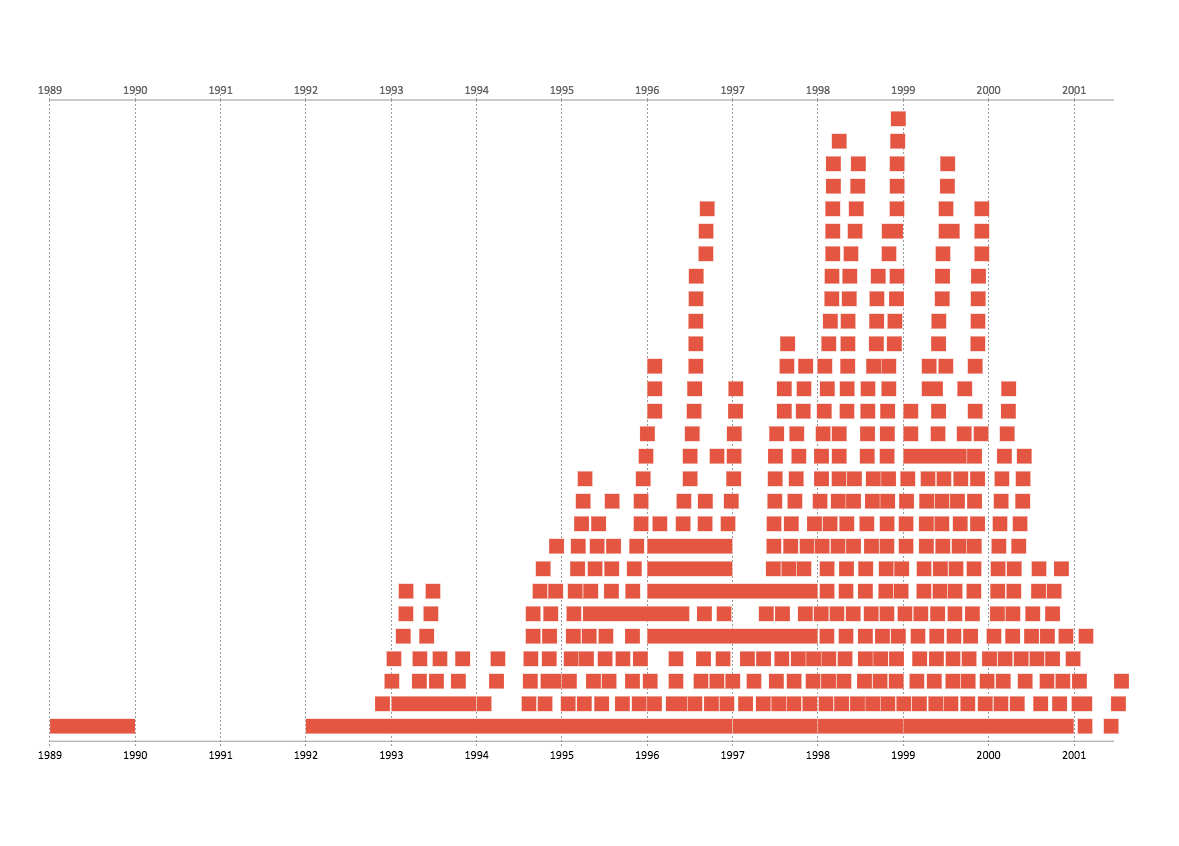
Drucker emphasized in her article that most visualizations oversimplify ambiguous concepts. Given that this dataset represented a contentious topic, I was worried about doing anything that might project a false sense of objectivity, which is one of the reasons why I tried keeping things simple. I also wanted to create something that gave a sense of the volume of events that were occurring simultaneously, which I thought that this format did well. However, if I was more proficient with this tool, I would have liked to have sorted the events by type and source.