Moby Dick, Dynamic Data
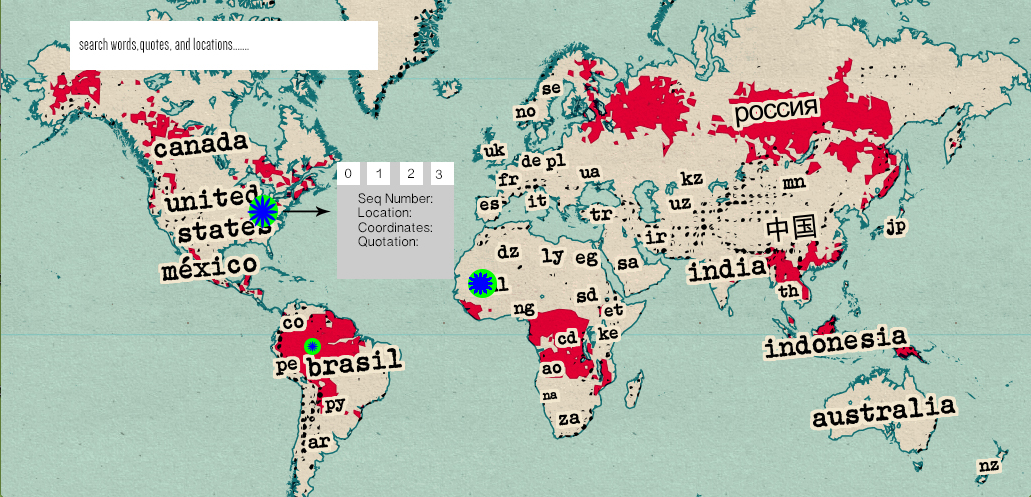
We struggled with some of the technical aspects of this assignment. While we were able to roughly generate a map with the points from the CSV file, we had trouble manipulating the visualization and data to out liking. However, we had many ideas for expanding the potential of the data set and the effectiveness of the visualization.
One approach we thought of to make the data more dynamic was manipulating the size of the drop pin based on the number of times a given location was referenced in the text. The greater the number of references the larger the point and vice versa. This would give users a map visualization whose information could be easily digested and therefore a more meaningful tool for learning. Instead of being accosted by an extremely large number of points, the visualization would consolidate some points if they were close enough in location to streamline the data.
Another idea we had was to parse through data points based on key words that appear in quotes throughout the book. There could be a search bar in the corner of the screen that allowed users to filter through points whose quotes did not contain a given word or phrase. For instance, a user trying to study the idea of wonder and Morocco in Melville’s novel could simply type the words into the engine and the corresponding points would enlarge while the others disappeared. This could be a useful tool for literary scholars trying to find patterns or repetition of descriptors in Moby Dick, and how these patterns apply to location. In addition to this feature, we would like to incorporate the ability to search by location in the same search bar, this would allow users to search some of his works based on the particular location.
We additionally would hope to make a few changes to the informatoin that displays when the user clicks on the points. Seeing that data would be grouped based on location, when the user clicks on the individual point, they have the option to search through the different indexes of occurences. For example if there were 3 mentions of Boston, MA in text, upon clicking on the point the indexes 0-3 would pop up and the user can look at the data of each occurence individually.We believe setting up the interface in such a manner would prove valuable to the user.
