diMAPspora Progress Summary
Data
The data we used came from Integrated Public Use Microdata Series (IPUMS) which is used to access individual population data from the US Census and American Community Survey (ACS). We used the American Community survey from 2005-2017 to gather information about what language is spoken in a given household, and where those inidividuals are located in orde to build this tool. We also used information from the US census to get population estimates by state for this range in order to calculate the density of speakers at a state level. We had also hoped to make this tool more granular and be able to display information at a county level, but there were only limited counties available.
Technological Approach
The past week we focused mainly on the technological aspect of our projected in order to create a working prototype. We are becoming much more familiar with the QGIS software that is used for our visualization, as well as the QGIS2Web plugin that allows us to create an interactive web interface. We dedicated a lot of time into getting the web plugin working and hosting the interface on a GitHub Page, which proved to be more challenging than expected. Now that we have succeeded in doing that, the focus will be on learning to customize our interface by better understanding the plugin.
Visual Design
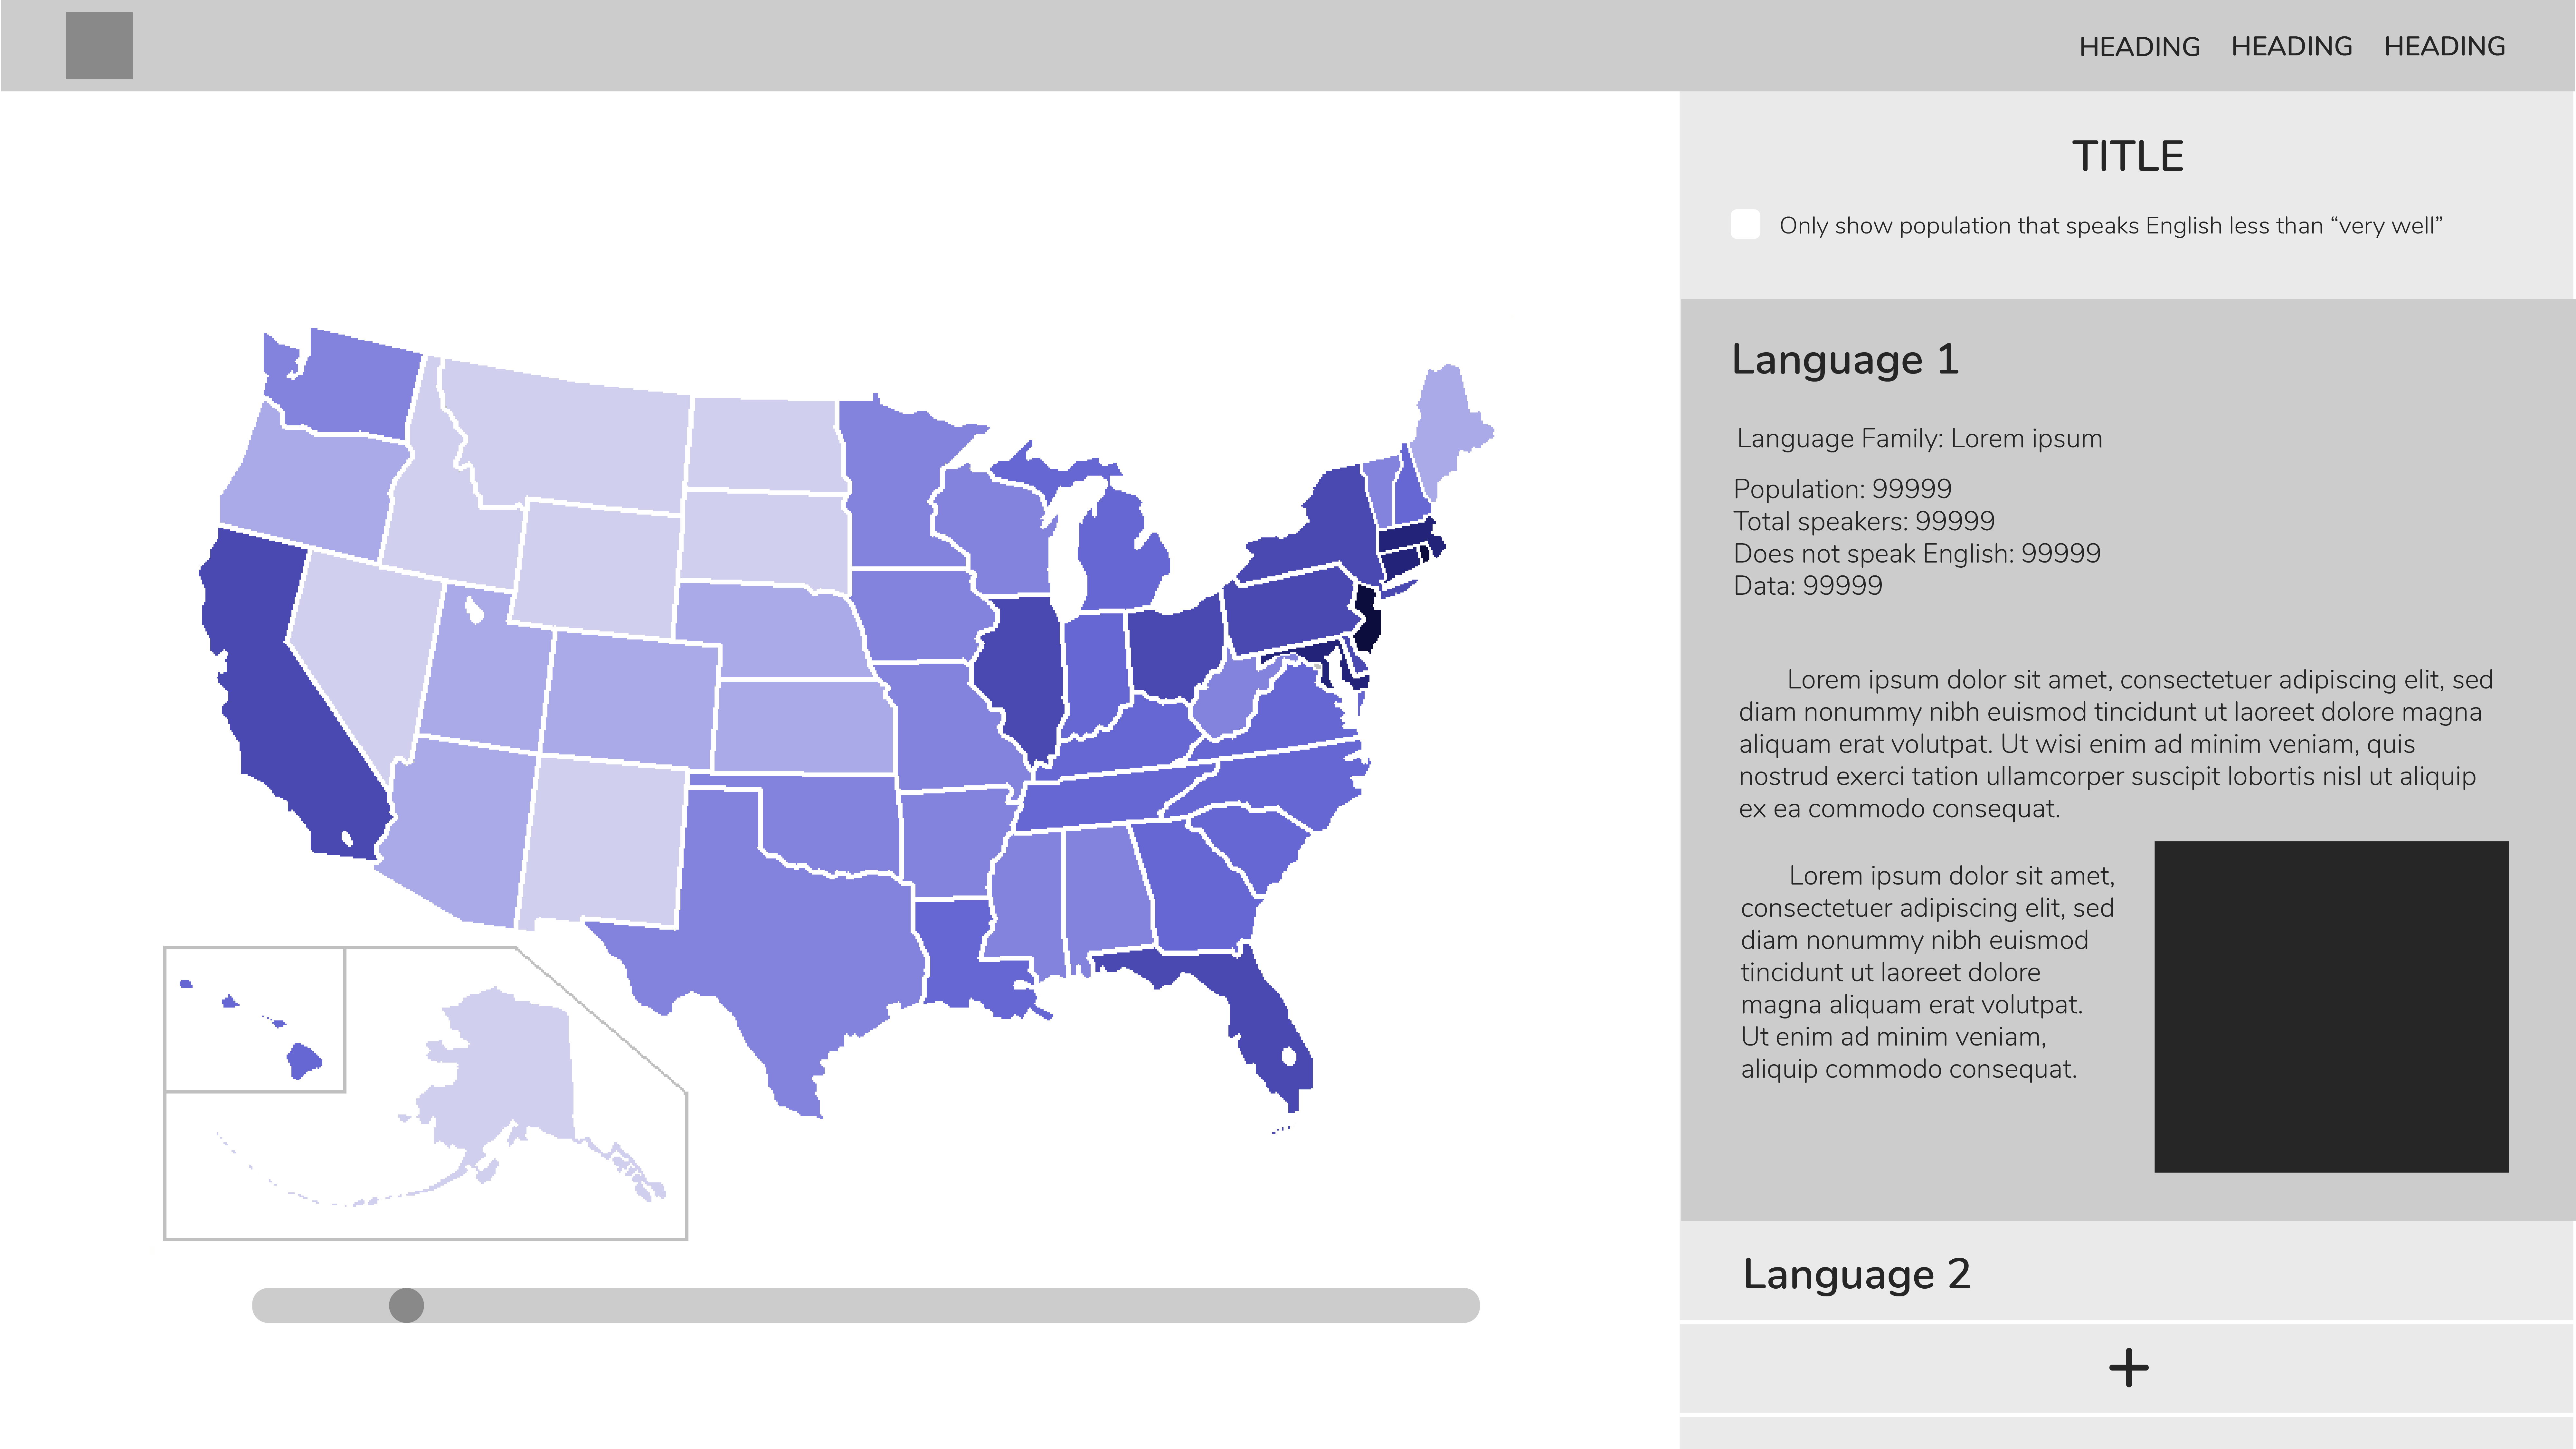
Since the technological aspect of our project took much more time and effort than expected, we haven’t yet been able to fully implement our design ideas. However, we have mockups that will be used as guides as we figure out how to customize using the plugin.
